Fig. 3
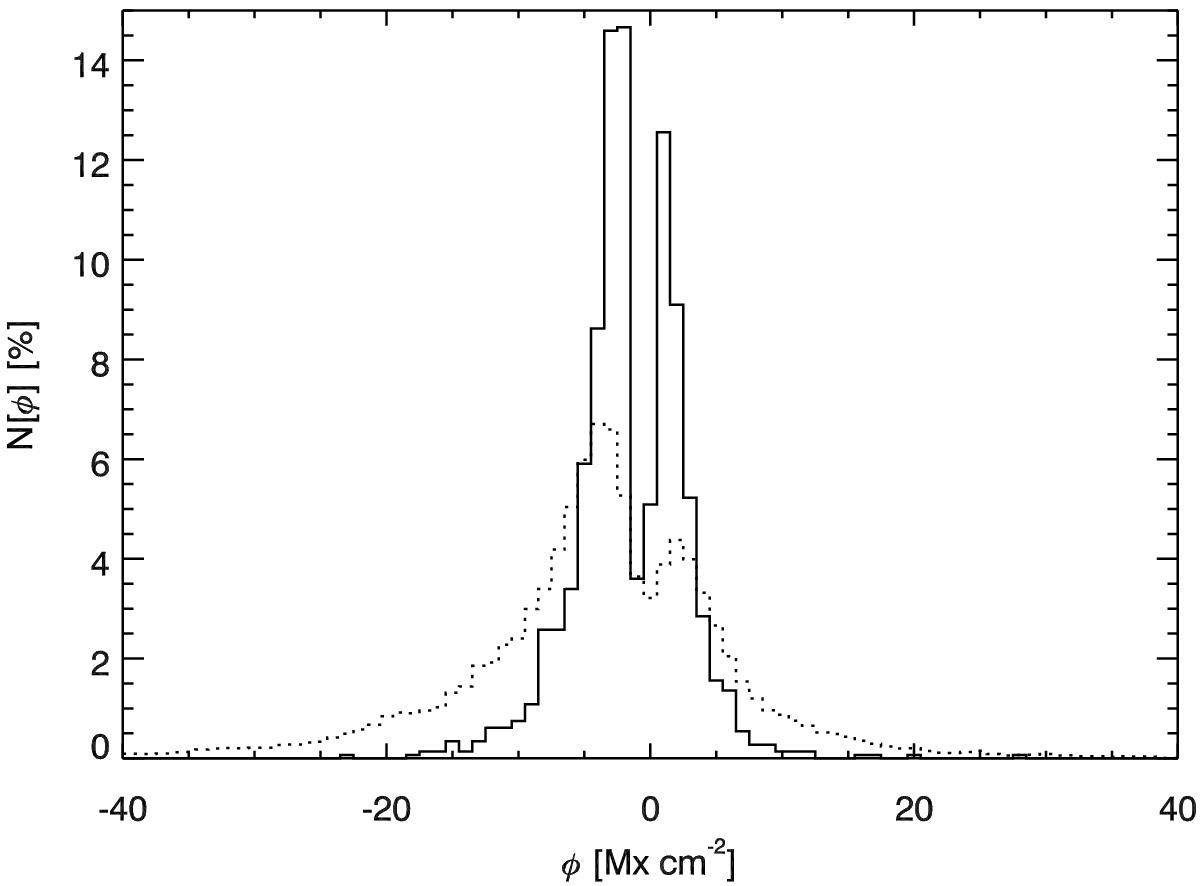
Histograms of the magnetic flux density inferred using a model with one magnetic atmosphere embedded in a field-free volume. The histograms represent the inversions at those pixels where Stokes Q or U or V are above 4σn, model 1C is preferred by the observations, and the Stokes V is a two-lobed profile. The solid line represents the values of the magnetic flux density for those pixels where the magnetic field strength, inclination, and filling factor are not reliably retrieved. The dotted line displays the histogram for those pixels where the magnetic field vector, inclination, and azimuth are well constrained by the observations.
Current usage metrics show cumulative count of Article Views (full-text article views including HTML views, PDF and ePub downloads, according to the available data) and Abstracts Views on Vision4Press platform.
Data correspond to usage on the plateform after 2015. The current usage metrics is available 48-96 hours after online publication and is updated daily on week days.
Initial download of the metrics may take a while.