Fig. 1
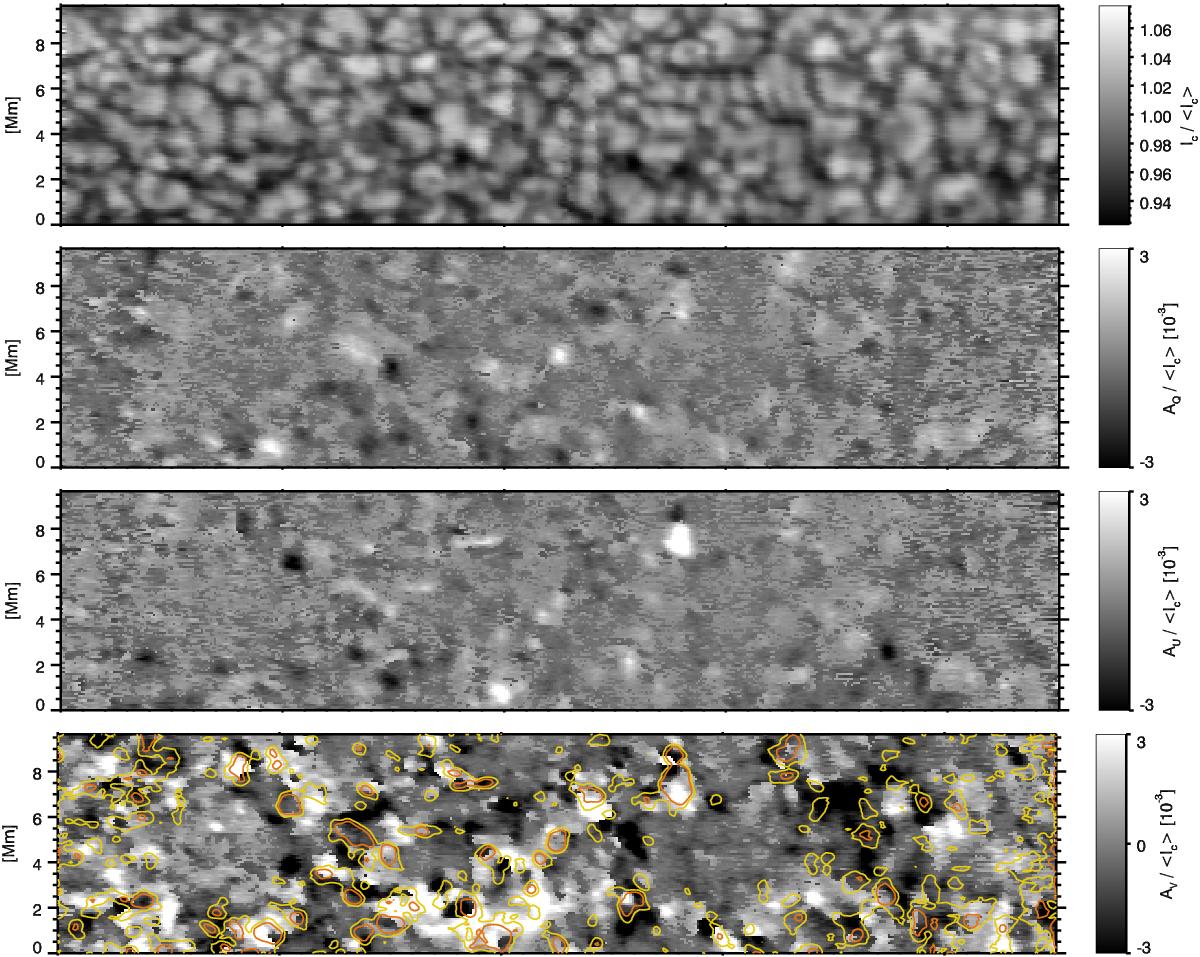
Intensity and polarisation maps of the observed quiet region at disc centre. The yellow and orange contours display the linear polarisation ![]() with amplitude levels of 1 × 10⁻³⟨ Ic ⟩ and 1.5 × 10⁻³⟨ Ic ⟩, respectively. Although the defined linear polarisation is a biased quantity, these contours are reliable since their values are more than one order of magnitude above the noise level. The amplitude of the circular polarisation has been computed as the highest value of the amplitudes of the two lobes, and the sign is given by the blue lobe. The amplitude of a lobe is calculated as the average value in two pixels around the maximals. The amplitudes of Stokes Q or U are calculated as the average in two pixels around the position of the maximum, taking the absolute value of the parameters.
with amplitude levels of 1 × 10⁻³⟨ Ic ⟩ and 1.5 × 10⁻³⟨ Ic ⟩, respectively. Although the defined linear polarisation is a biased quantity, these contours are reliable since their values are more than one order of magnitude above the noise level. The amplitude of the circular polarisation has been computed as the highest value of the amplitudes of the two lobes, and the sign is given by the blue lobe. The amplitude of a lobe is calculated as the average value in two pixels around the maximals. The amplitudes of Stokes Q or U are calculated as the average in two pixels around the position of the maximum, taking the absolute value of the parameters.
Current usage metrics show cumulative count of Article Views (full-text article views including HTML views, PDF and ePub downloads, according to the available data) and Abstracts Views on Vision4Press platform.
Data correspond to usage on the plateform after 2015. The current usage metrics is available 48-96 hours after online publication and is updated daily on week days.
Initial download of the metrics may take a while.