Fig. 9
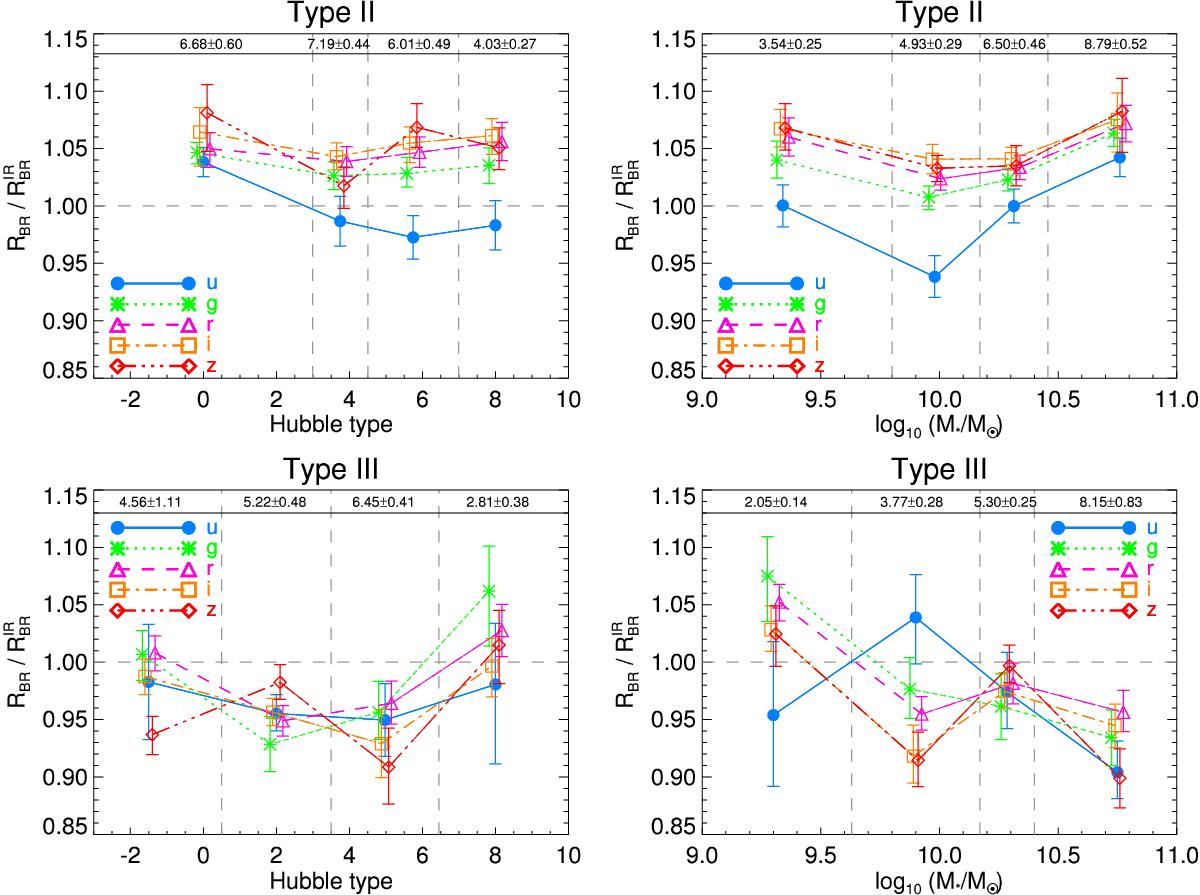
Break radius (RBR) in different bands, normalized with the infrared ![]() , shown separately for Type II (upper panels) and III breaks (lower panels). In the left panels we show the behaviour as a function of Hubble types, and in the right panels as a function of stellar masses. In every panel the galaxies are divided into four bins with roughly the same number of galaxies, and the mean value is calculated in each bin. The bin limits are shown with vertical grey dashed lines. The error bars indicate bootstrapped ± 1σ uncertainty of the mean. The numerical values in the box at the top of each bin indicate the mean value of the infrared data in that bin, and bootstrapped ± 1σ uncertainty of the mean.
, shown separately for Type II (upper panels) and III breaks (lower panels). In the left panels we show the behaviour as a function of Hubble types, and in the right panels as a function of stellar masses. In every panel the galaxies are divided into four bins with roughly the same number of galaxies, and the mean value is calculated in each bin. The bin limits are shown with vertical grey dashed lines. The error bars indicate bootstrapped ± 1σ uncertainty of the mean. The numerical values in the box at the top of each bin indicate the mean value of the infrared data in that bin, and bootstrapped ± 1σ uncertainty of the mean.
Current usage metrics show cumulative count of Article Views (full-text article views including HTML views, PDF and ePub downloads, according to the available data) and Abstracts Views on Vision4Press platform.
Data correspond to usage on the plateform after 2015. The current usage metrics is available 48-96 hours after online publication and is updated daily on week days.
Initial download of the metrics may take a while.