Fig. 6
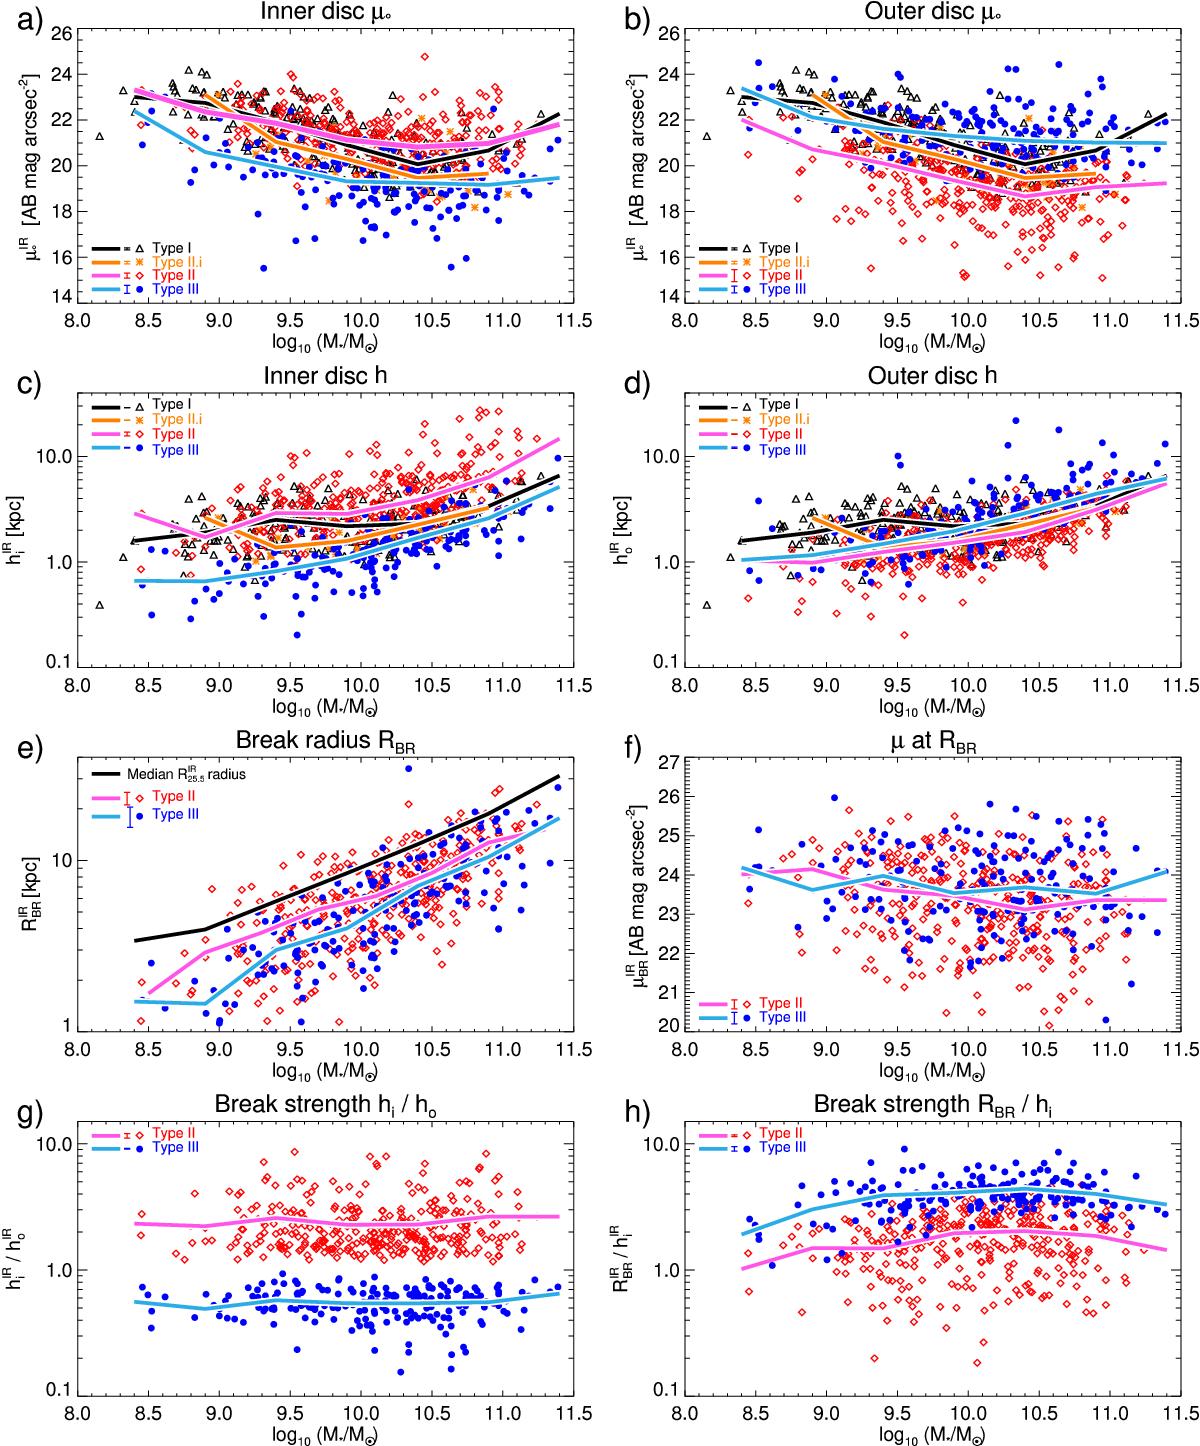
Parameters of the discs and breaks in the infrared as a function of stellar mass. In every panel the solid lines indicates the running medians of the values. The surface brightness values have been corrected for inclination. The error bars near the figure legend indicate the mean errors of the values, calculated with propagation of errors.
Current usage metrics show cumulative count of Article Views (full-text article views including HTML views, PDF and ePub downloads, according to the available data) and Abstracts Views on Vision4Press platform.
Data correspond to usage on the plateform after 2015. The current usage metrics is available 48-96 hours after online publication and is updated daily on week days.
Initial download of the metrics may take a while.