Fig. 5
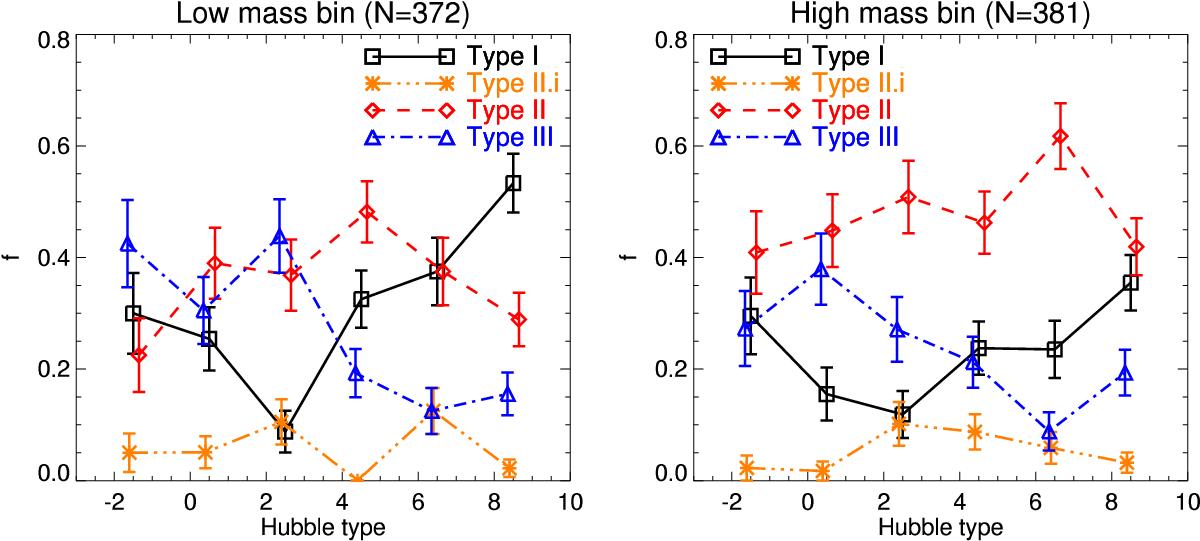
Fractions of the break types as a function of the galaxy Hubble type in the infrared sample shown separately for low mass (left panel), and high mass bins (right panel). The galaxies are divided to low and high mass bins by the median mass of the Hubble type bins shown in Fig. 1. The error bars are calculated using binomial statistics, and denote the ± 1σ uncertainties.
Current usage metrics show cumulative count of Article Views (full-text article views including HTML views, PDF and ePub downloads, according to the available data) and Abstracts Views on Vision4Press platform.
Data correspond to usage on the plateform after 2015. The current usage metrics is available 48-96 hours after online publication and is updated daily on week days.
Initial download of the metrics may take a while.