Fig. 14
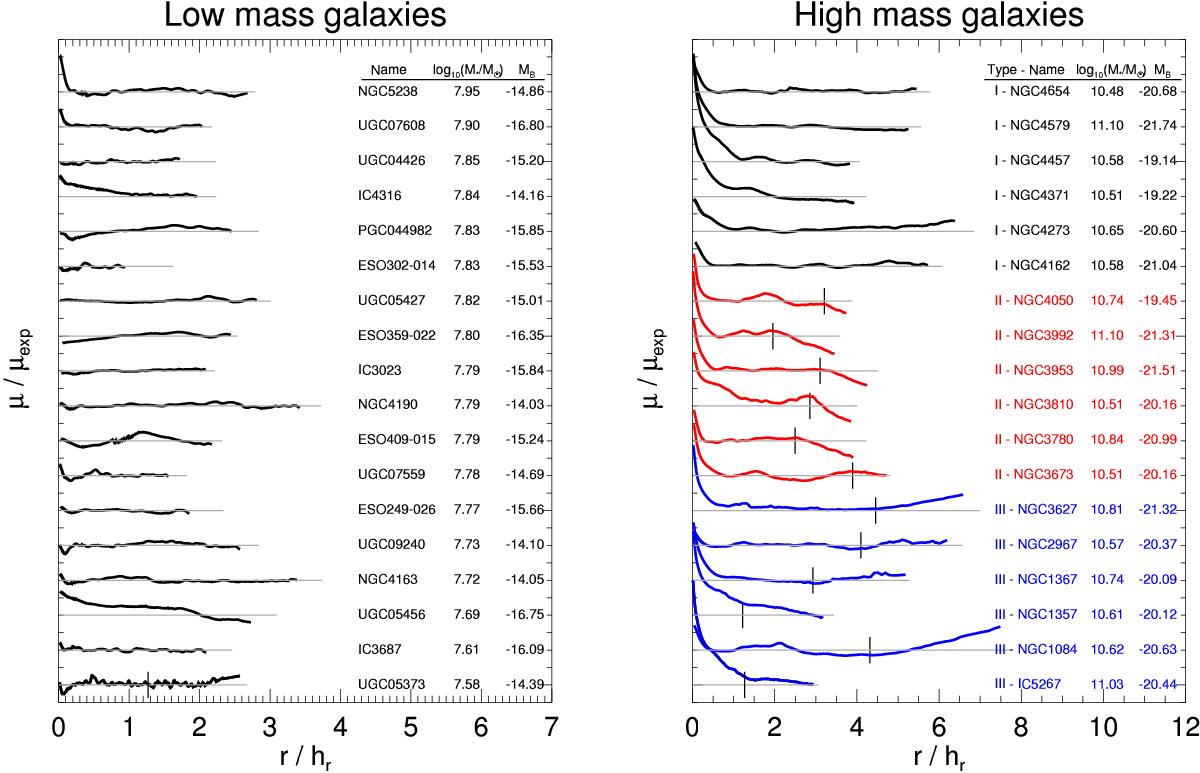
3.6 μm radial surface brightness profiles normalized with the exponential disc surface brightness (μexp), and disc scalelengths (hr), of the two dimensional decomposition values from Spitzer Survey of Stellar Structure in Galaxies Pipeline 4 (S4G P4, Salo et al. 2015). A single exponential disc would appear as horizontal line in this plot (grey lines). In the left panel we show a random sample of 18 low mass galaxies, which are not part of this study but fulfil the inclination criteria of the sample selection (b/a> 0.5). In the right panel we show random sample of 18 high mass galaxies with Type I, II, and III disc profiles, which are part of this study. In the high mass galaxies we show the location of the Type II or III break by a short vertical line segment. All the profiles have been cut by the μ = 25.5 mag arcsec-2 radius of the 3.6 μm data.
Current usage metrics show cumulative count of Article Views (full-text article views including HTML views, PDF and ePub downloads, according to the available data) and Abstracts Views on Vision4Press platform.
Data correspond to usage on the plateform after 2015. The current usage metrics is available 48-96 hours after online publication and is updated daily on week days.
Initial download of the metrics may take a while.