Fig. 1
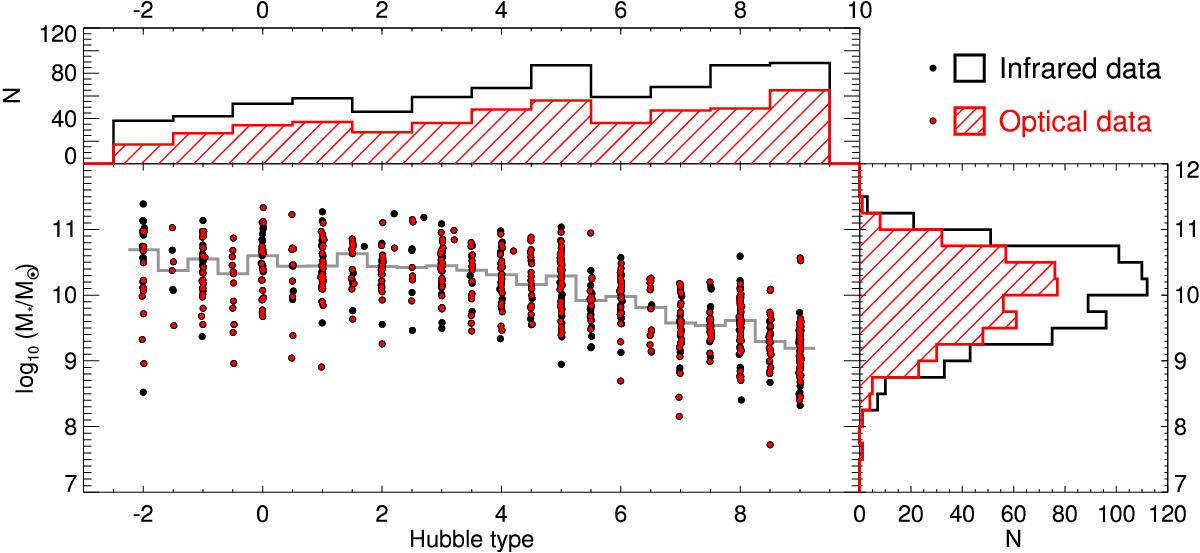
Stellar mass of the sample galaxies as a function of the Hubble type. In addition, histograms of the Hubble type (top) and stellar mass (right) distributions are shown. Galaxies with infrared data and galaxies with optical data in at least one waveband are shown separately in all panels. The grey line in the main panel shows the median mass in each Hubble type bin, and defines the division to “high” and “low” mass galaxies used in Sect. 3.1.
Current usage metrics show cumulative count of Article Views (full-text article views including HTML views, PDF and ePub downloads, according to the available data) and Abstracts Views on Vision4Press platform.
Data correspond to usage on the plateform after 2015. The current usage metrics is available 48-96 hours after online publication and is updated daily on week days.
Initial download of the metrics may take a while.