Open Access
Fig. 2
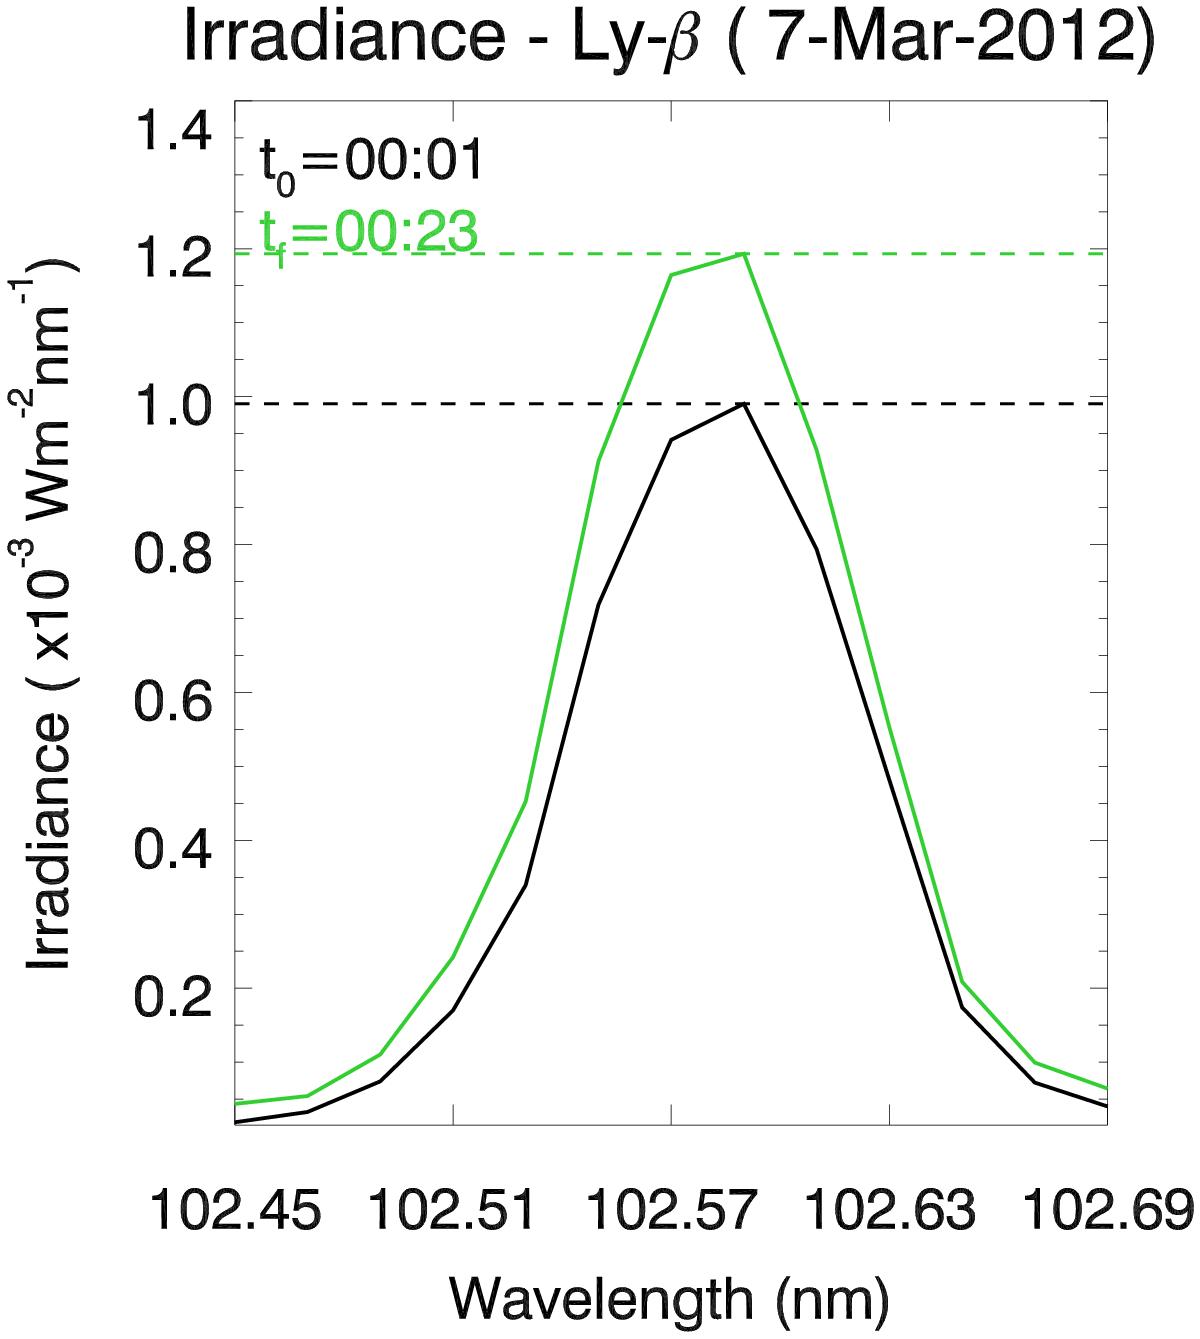
The Ly-β line before the onset of the 07th March 2012 flare (black) and during the flare (green). An irradiance enhancement can be seen in the core of the line, indicated by the position of the dashed line.
Current usage metrics show cumulative count of Article Views (full-text article views including HTML views, PDF and ePub downloads, according to the available data) and Abstracts Views on Vision4Press platform.
Data correspond to usage on the plateform after 2015. The current usage metrics is available 48-96 hours after online publication and is updated daily on week days.
Initial download of the metrics may take a while.