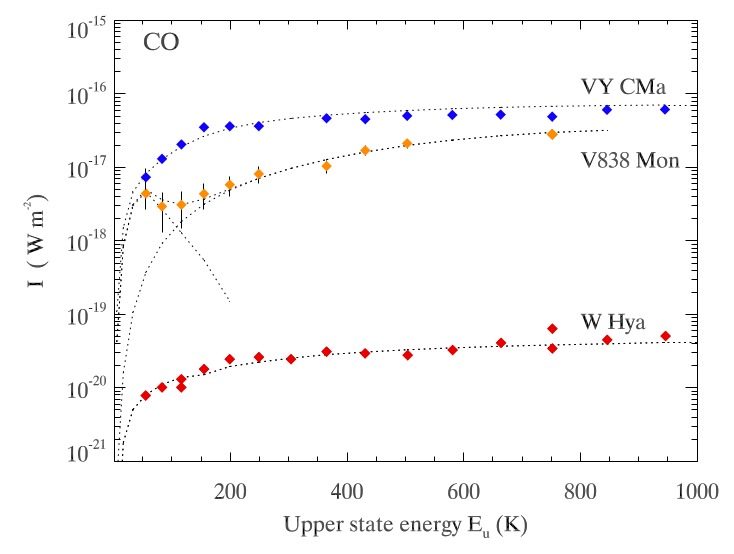
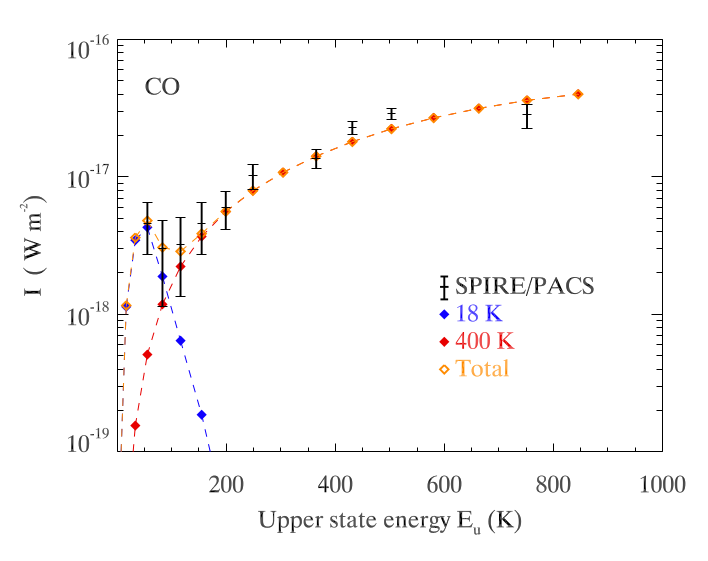
Fig. 9
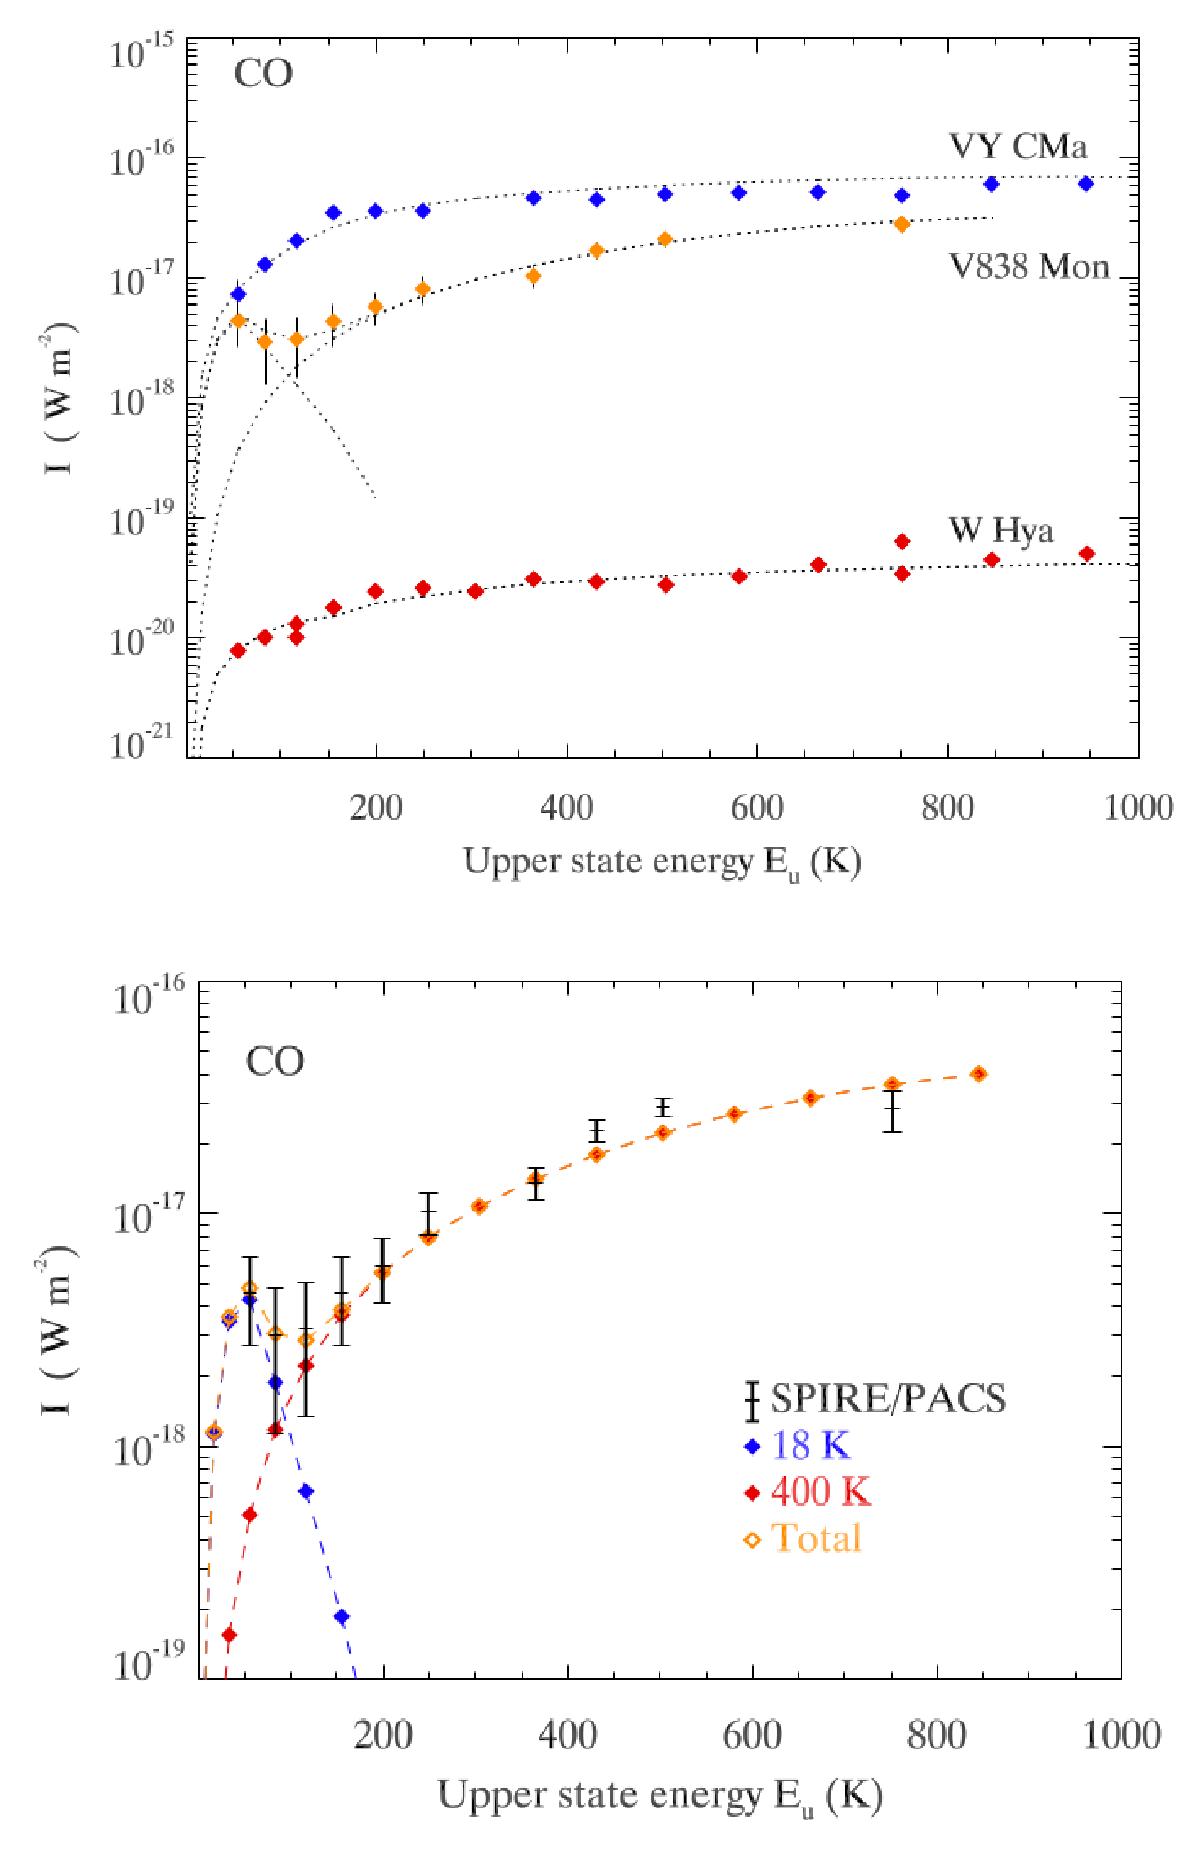
Top: energy diagram for the V838 Mon CO lines, compared with the red superigant, VY CMa and the AGB star, W Hya. The X-axis indicates the upper state energy of the CO transition (Eup) in Kelvin, and the Y-axis shows the line intensities of the CO lines in W m-2. V838 Mon shows two discrete components (warm and cold) of the CO energy distribution. Symbols are data and dotted lines are the fits (ours to V838 Mon, and using the values from the respective papers for the other two stars). Bottom: energy diagram for CO lines detected by SPIRE and PACS (black symbols), where the X-axis shows the upper state energy of the CO transition (Eup) in Kelvin, and the Y-axis shows the line intensities of the CO lines in W m-2. Two discrete components of CO energy distributions were detected, which were modelled with 18 K (blue) and 400 K (red). The sum of these warm and cold components is plotted in orange.
Current usage metrics show cumulative count of Article Views (full-text article views including HTML views, PDF and ePub downloads, according to the available data) and Abstracts Views on Vision4Press platform.
Data correspond to usage on the plateform after 2015. The current usage metrics is available 48-96 hours after online publication and is updated daily on week days.
Initial download of the metrics may take a while.