Fig. 8
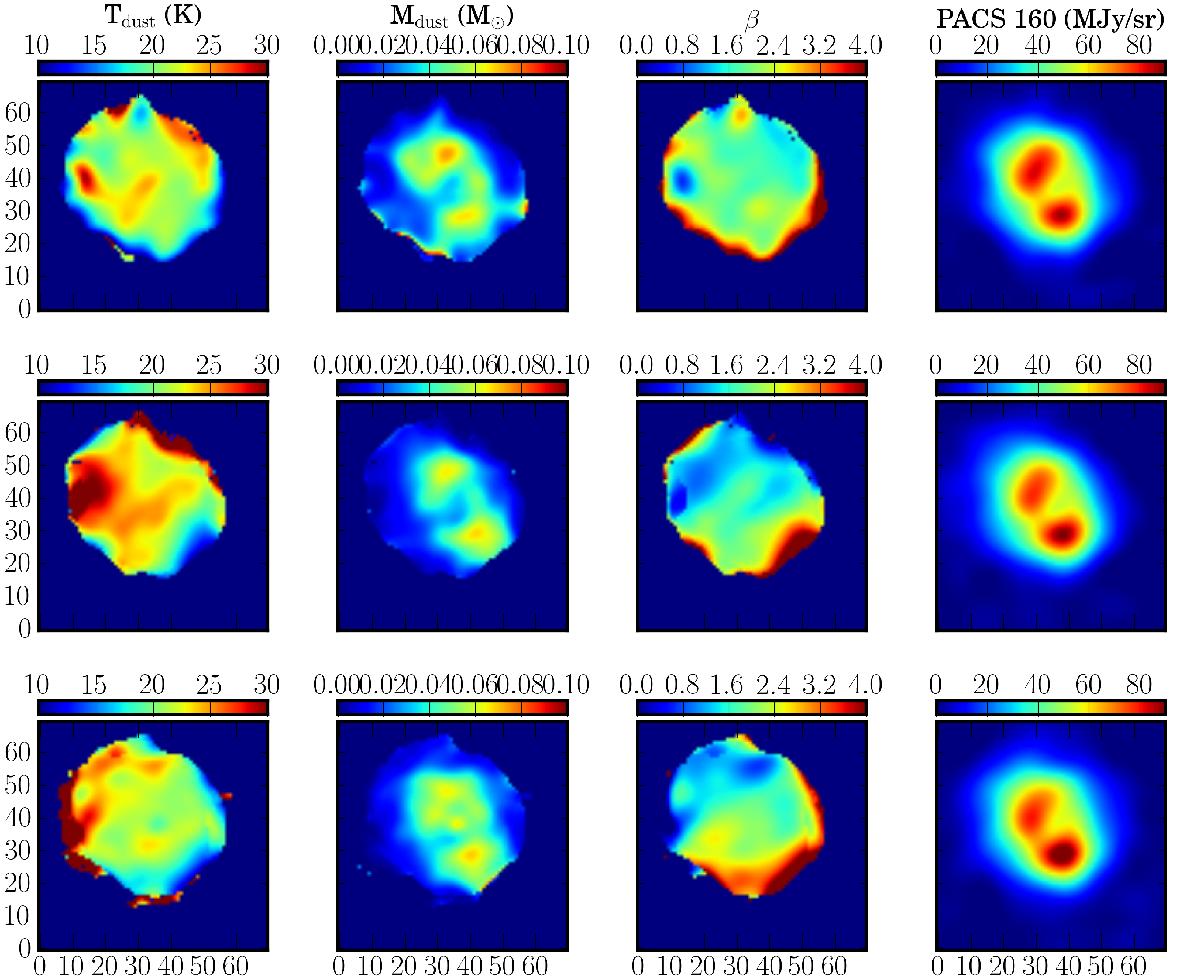
From left to right: dust temperature (first column), dust mass (second column), dust emissivity index (third column), and PACS 160 μm flux density (fourth column) maps of V838 Mon created from the maps convolved to 250 μm and β derived from the 350 μm convolved data set. From top to bottom: Epoch 1, 2, and 3. See text for details on the procedure. Orientation is the same as in Fig. 1.
Current usage metrics show cumulative count of Article Views (full-text article views including HTML views, PDF and ePub downloads, according to the available data) and Abstracts Views on Vision4Press platform.
Data correspond to usage on the plateform after 2015. The current usage metrics is available 48-96 hours after online publication and is updated daily on week days.
Initial download of the metrics may take a while.