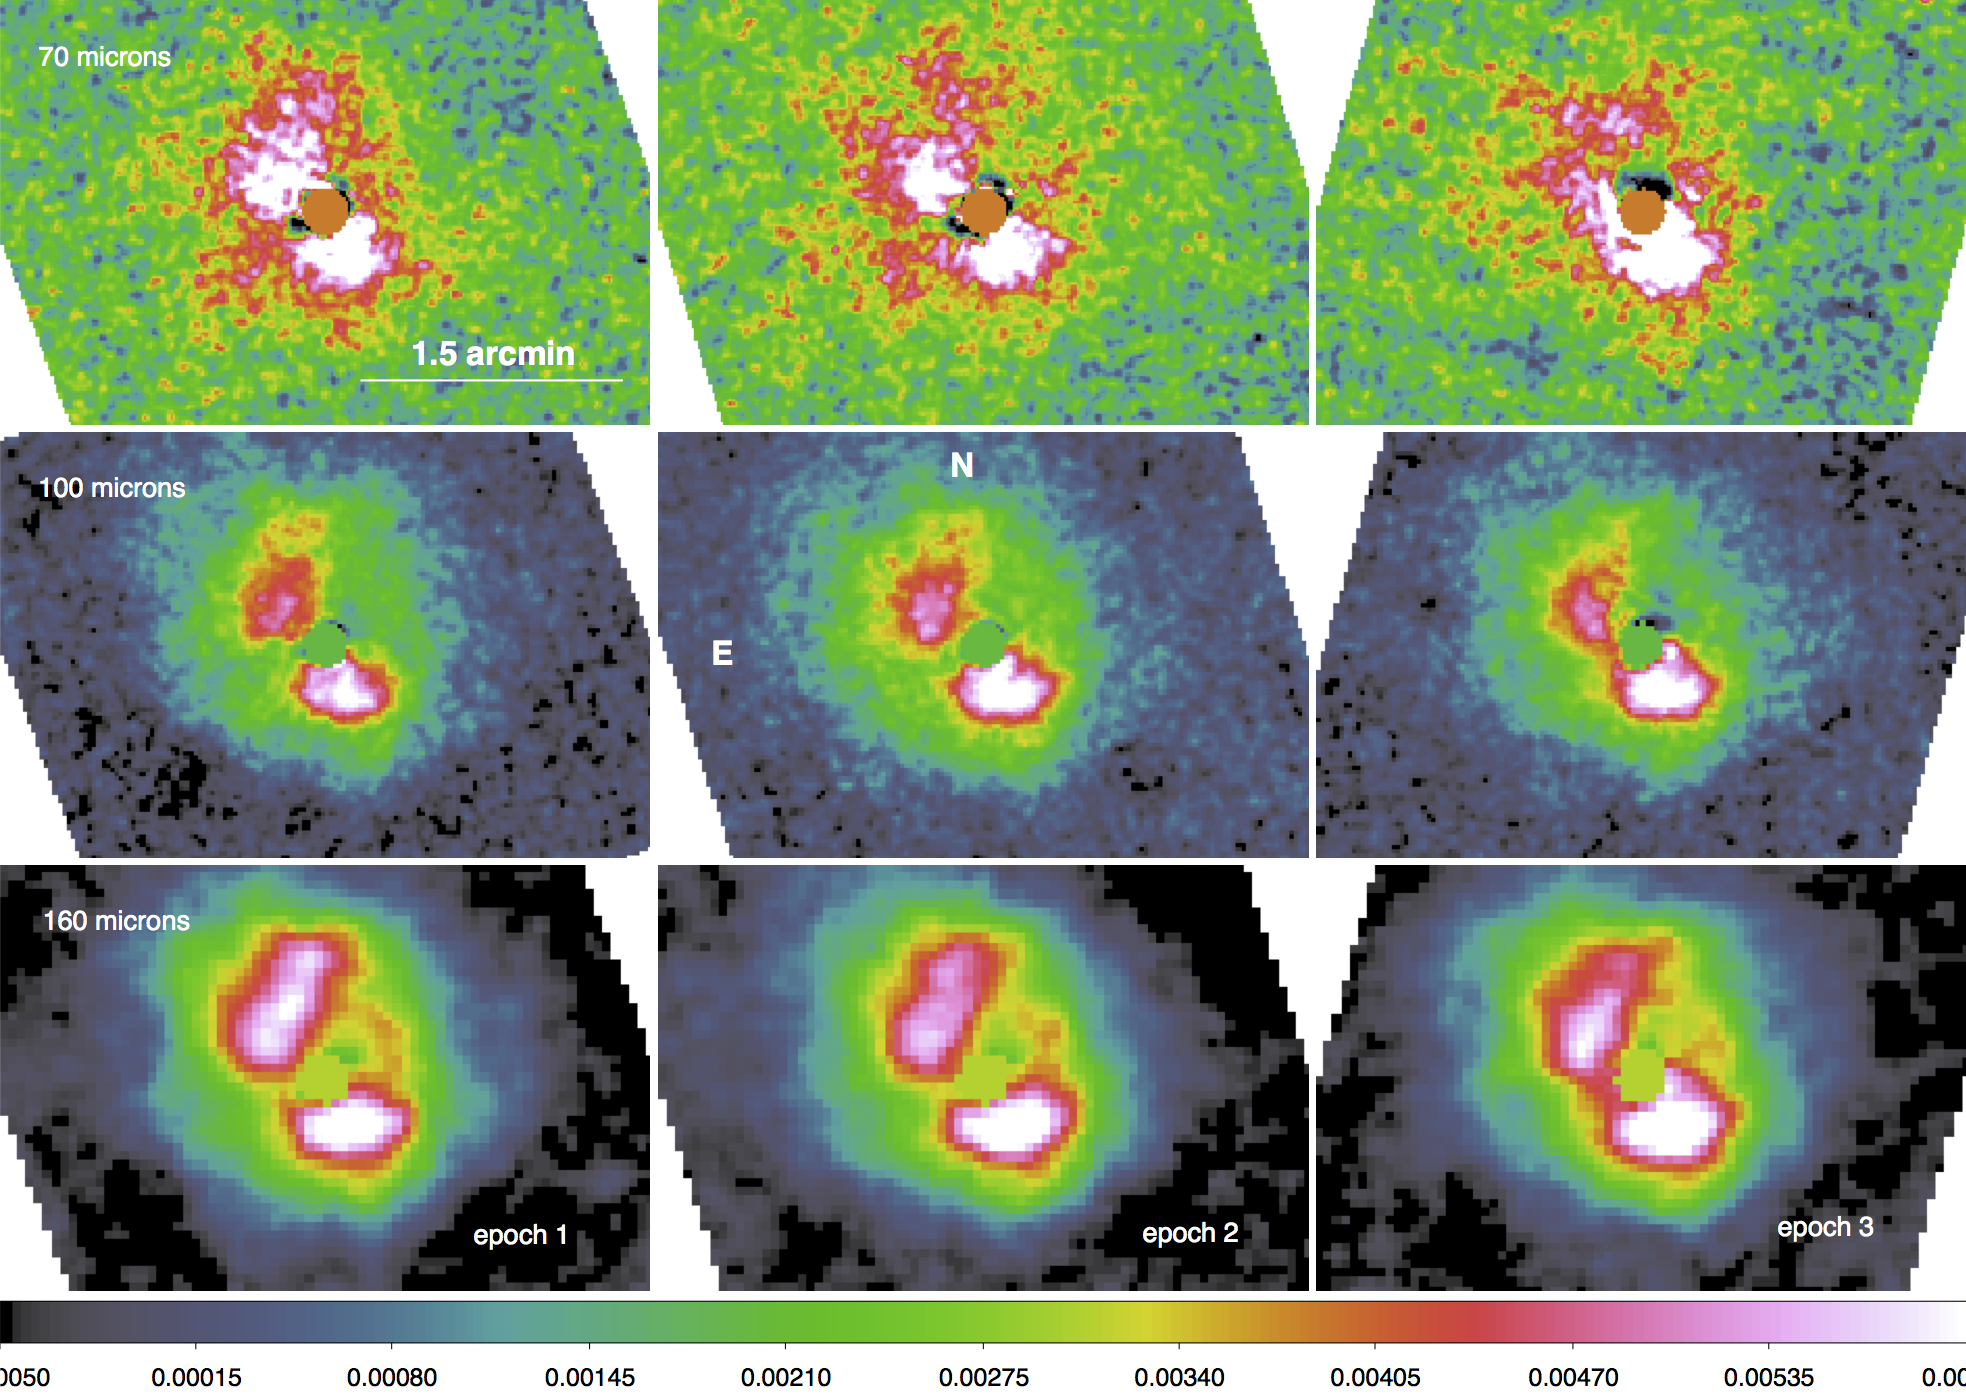
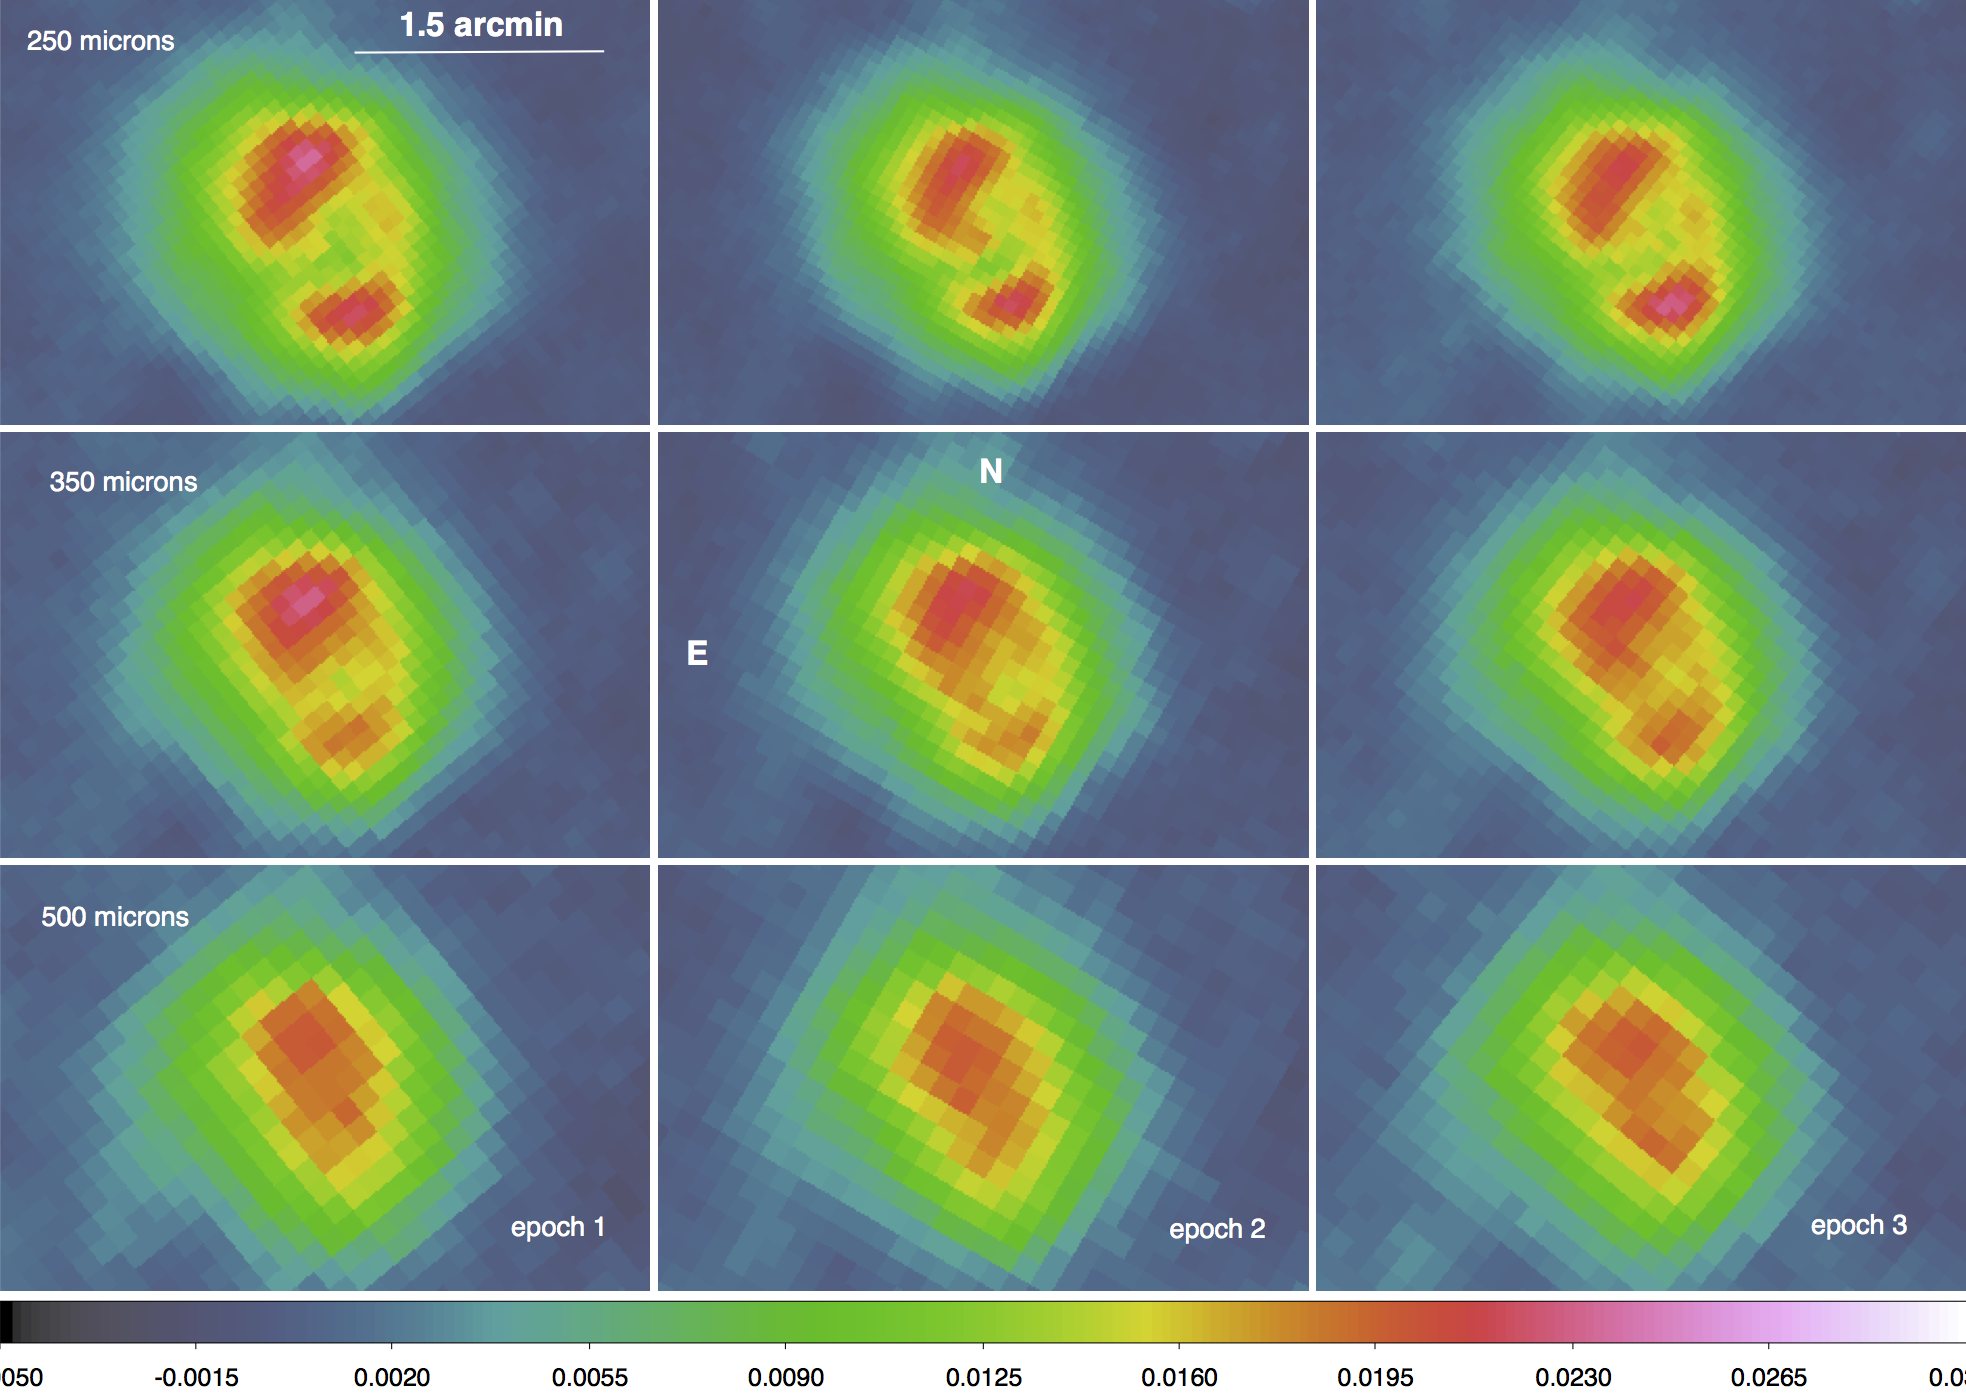
Fig. 4
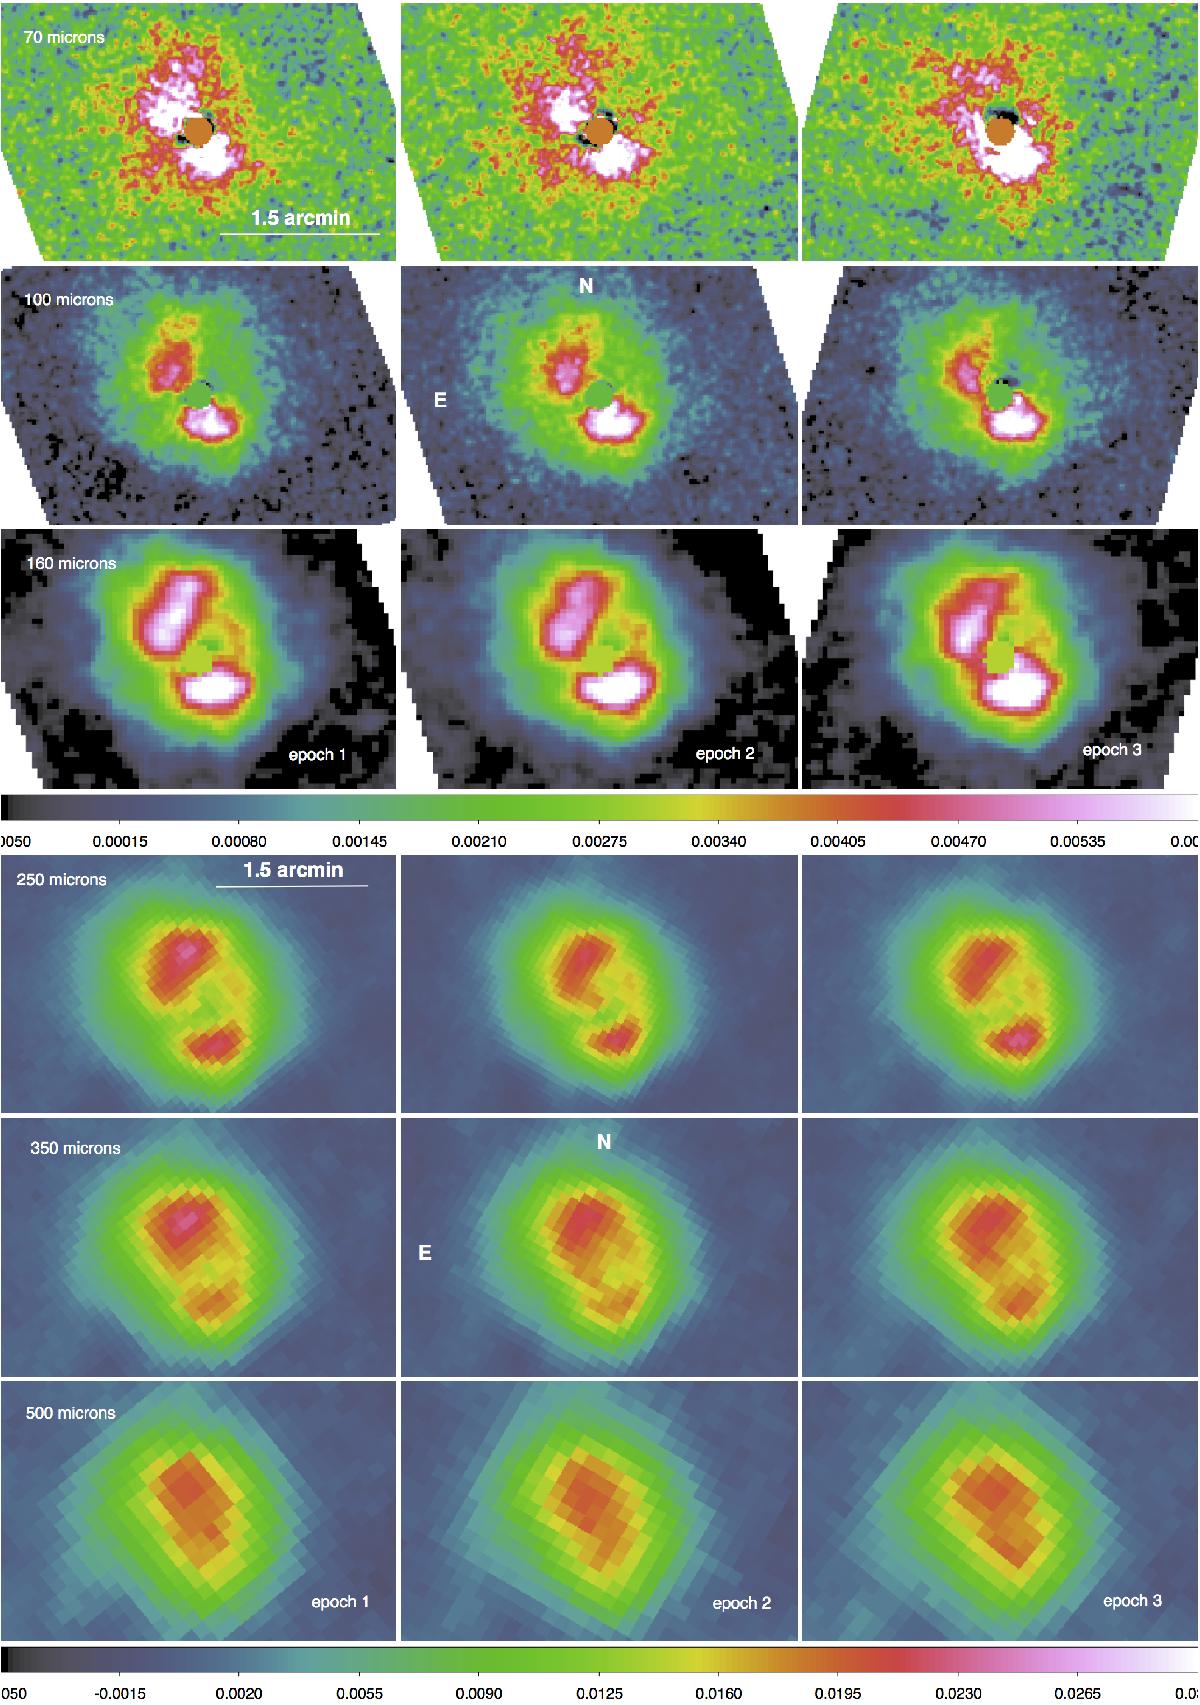
SPIRE and PACS maps with the point source removed and residual replaced by a blank patch (on the 70 μm some residuals remain). Scaling ranges are chosen based on the peak flux density. PACS: −0.0005−0.001 Jy/pixel (70 μm), −0.0004−0.006 Jy/pixel (100 μm), −0.0001−0.02 Jy/pixel (160 μm), with pixel sizes of 1′′, 1.5′′, and 3′′, respectively. SPIRE: −0.005−0.03 Jy/pixel (250 μm), −0.005−0.025 Jy/pixel (350 μm), −0.005−0.02 Jy/pixel (500 μm), with pixels sizes of 4.5′′, 6.25′′, and 9′′, respectively. N–E is indicated in the central maps.
Current usage metrics show cumulative count of Article Views (full-text article views including HTML views, PDF and ePub downloads, according to the available data) and Abstracts Views on Vision4Press platform.
Data correspond to usage on the plateform after 2015. The current usage metrics is available 48-96 hours after online publication and is updated daily on week days.
Initial download of the metrics may take a while.