Free Access
Fig. 10
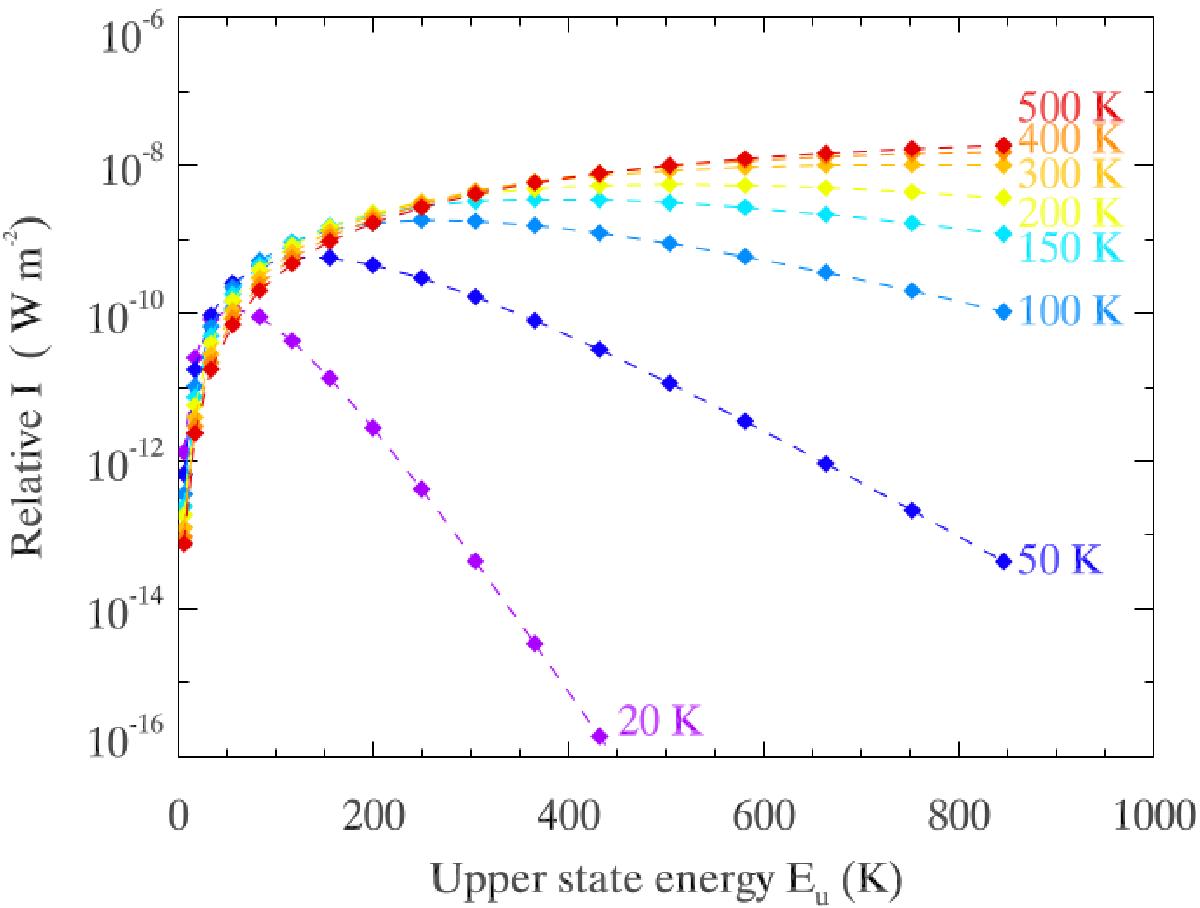
Demonstration of how the CO energy diagram changes as a function of the kinetic temperature. This applies to the optically thin gas and with a constant beam size across all the transitions, which is not the case for V838 Mon. However, this figure is just to demonstrate how the curve changes with temperature.
Current usage metrics show cumulative count of Article Views (full-text article views including HTML views, PDF and ePub downloads, according to the available data) and Abstracts Views on Vision4Press platform.
Data correspond to usage on the plateform after 2015. The current usage metrics is available 48-96 hours after online publication and is updated daily on week days.
Initial download of the metrics may take a while.