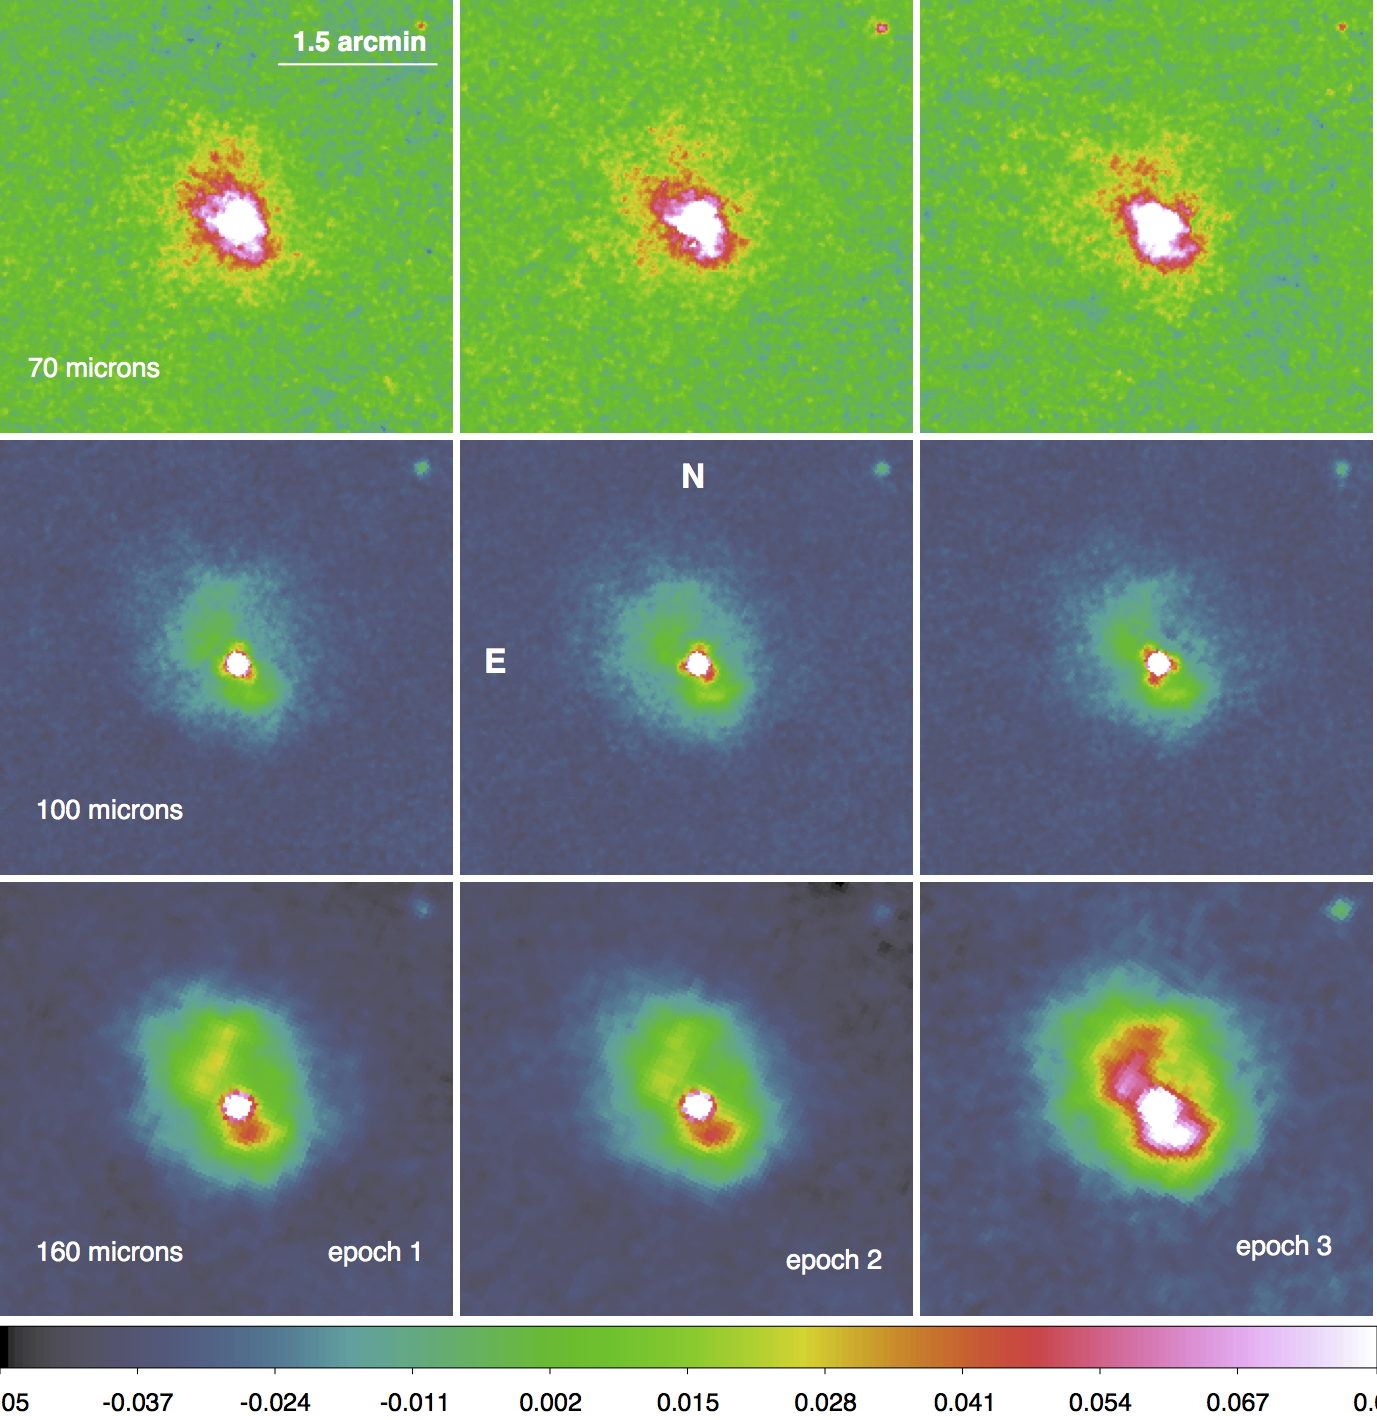
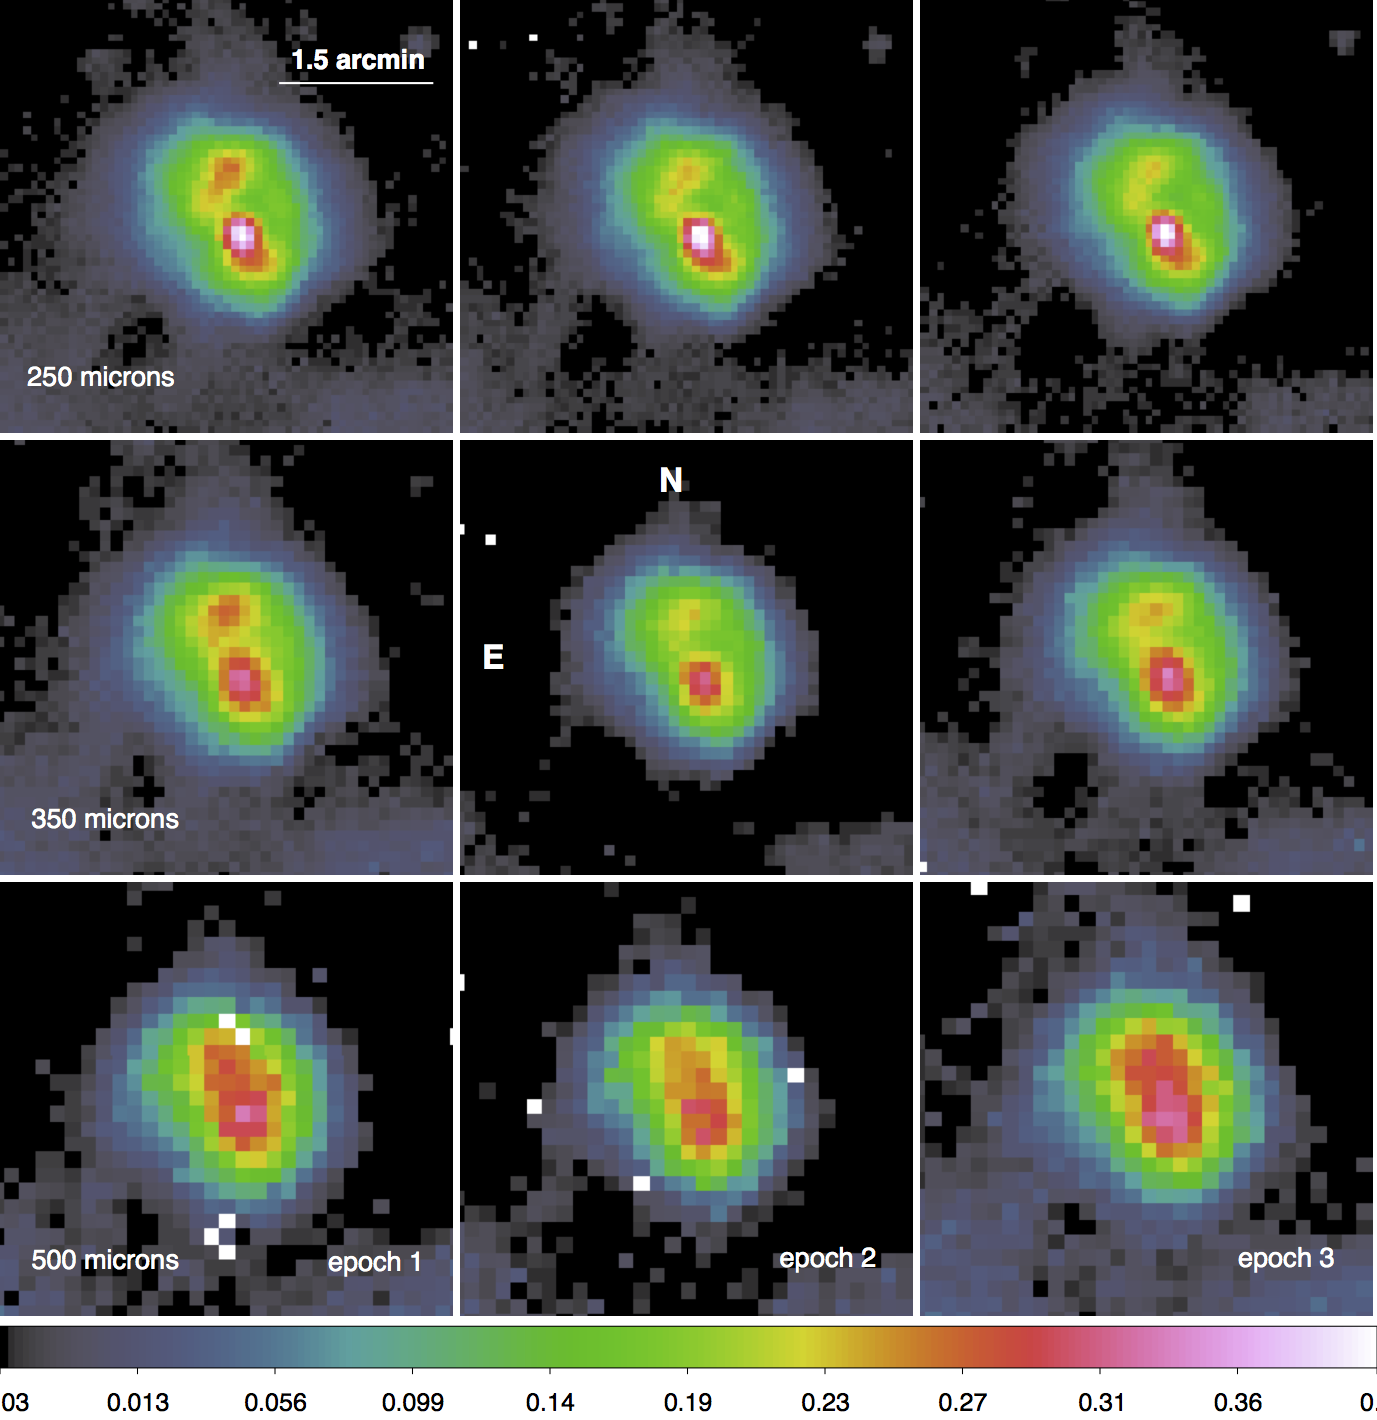
Fig. 1
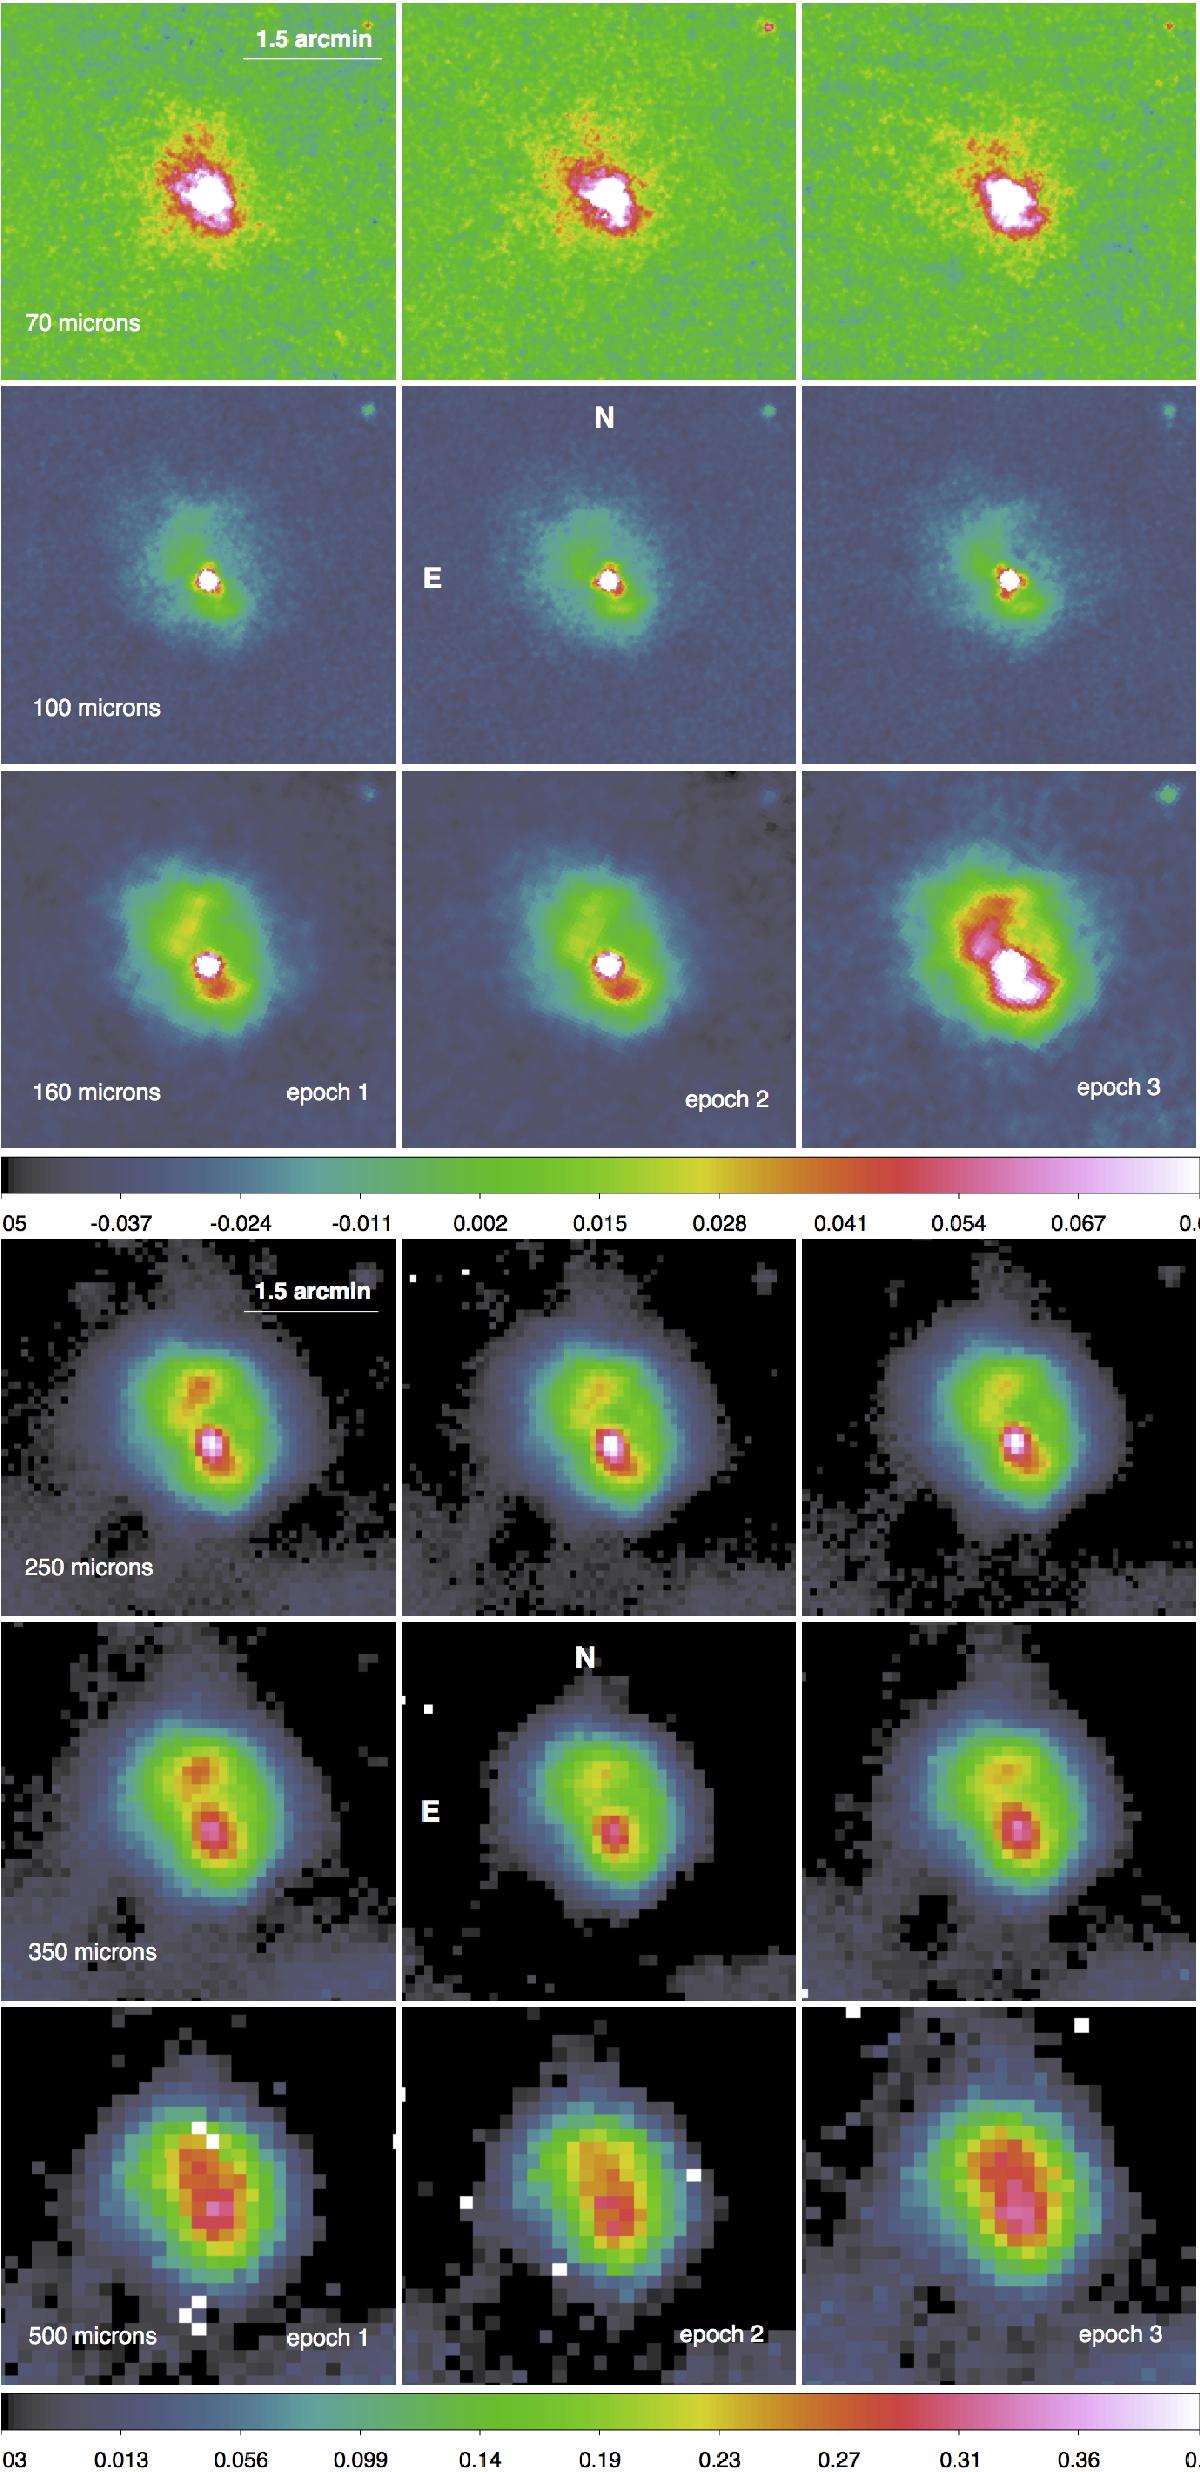
Top to bottom: PACS (top three) and SPIRE (bottom three) maps at the indicated wavelengths and epochs. The flux scaling, in increasing wavelength order, is: PACS −0.05 to 0.08/0.2/0.4 Jy beam-1; SPIRE −0.03 to 0.8/0.6/0.4 Jy beam-1. The brightest point on each map is V838 Mon; the tri-lobal shape of the PACS beam can be seen on the 100 μm maps. N–E is indicated in the central maps.
Current usage metrics show cumulative count of Article Views (full-text article views including HTML views, PDF and ePub downloads, according to the available data) and Abstracts Views on Vision4Press platform.
Data correspond to usage on the plateform after 2015. The current usage metrics is available 48-96 hours after online publication and is updated daily on week days.
Initial download of the metrics may take a while.