Free Access
Fig. 9
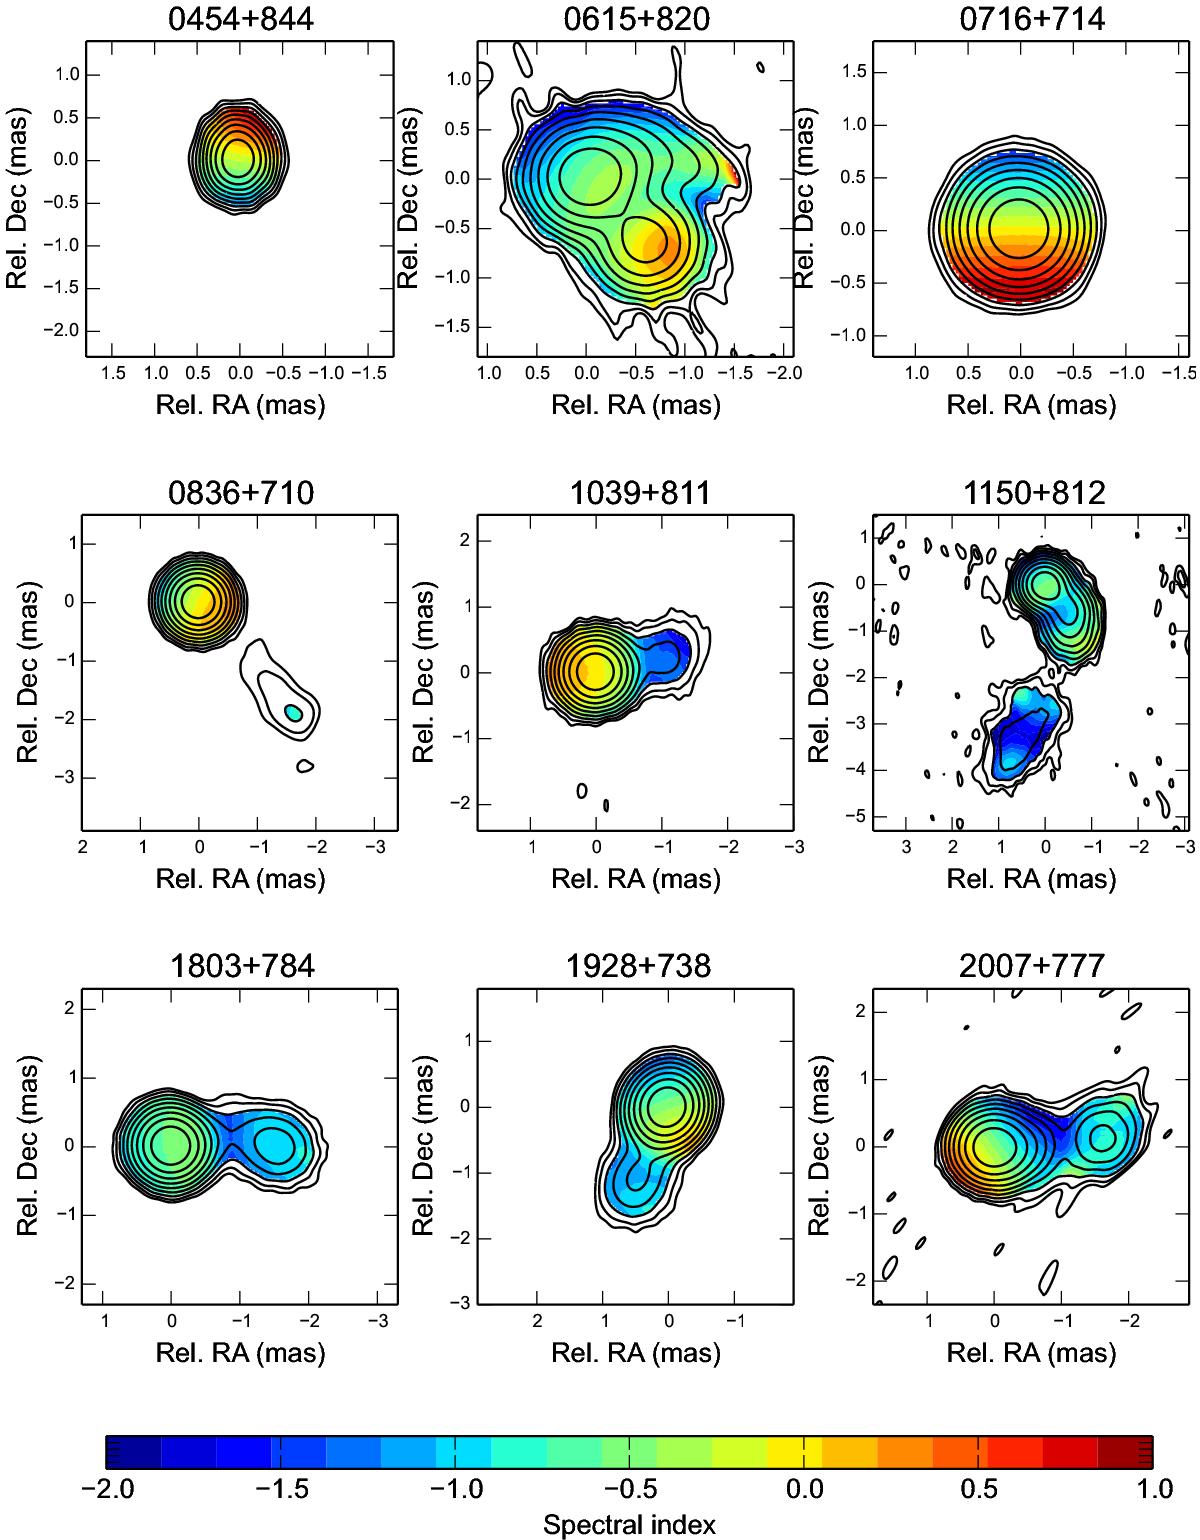
Spectral-index distribution of a subset of the S5 sources (see text). The contours correspond to the 43.1 GHz images, convolved with a beam of 0.6 × 0.6 mas FWHM. We notice that the effects of the core-shift uncertainties (Table 4) are not shown in this figure.
Current usage metrics show cumulative count of Article Views (full-text article views including HTML views, PDF and ePub downloads, according to the available data) and Abstracts Views on Vision4Press platform.
Data correspond to usage on the plateform after 2015. The current usage metrics is available 48-96 hours after online publication and is updated daily on week days.
Initial download of the metrics may take a while.