Free Access
Fig. 5
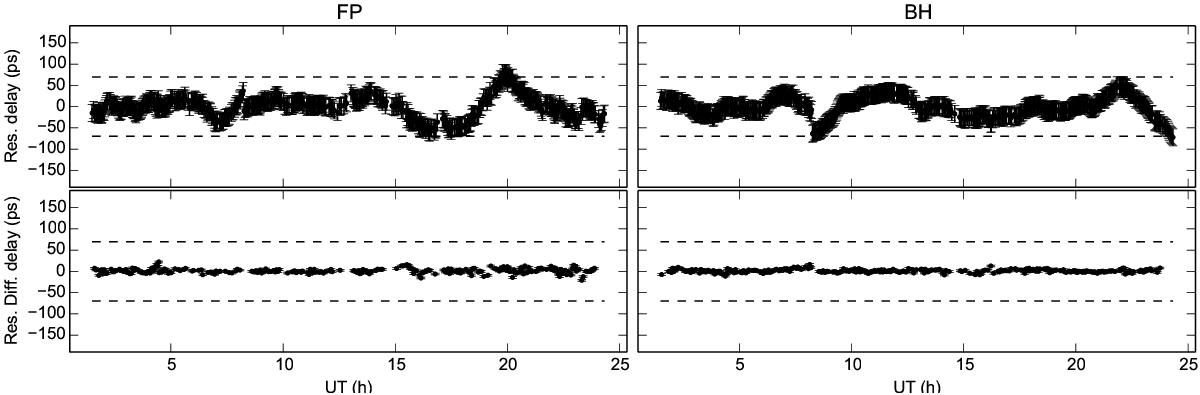
Post-fit residual phase delays for Fort Davis–Pie Town (left) and Brewster–Hancock (right) for all observed sources. The error bars are shown in all figures: undifferenced delays (top); differenced delays (bottom). The dashed lines correspond to the delays of a ±2π phase ambiguity.
Current usage metrics show cumulative count of Article Views (full-text article views including HTML views, PDF and ePub downloads, according to the available data) and Abstracts Views on Vision4Press platform.
Data correspond to usage on the plateform after 2015. The current usage metrics is available 48-96 hours after online publication and is updated daily on week days.
Initial download of the metrics may take a while.