Fig. 10
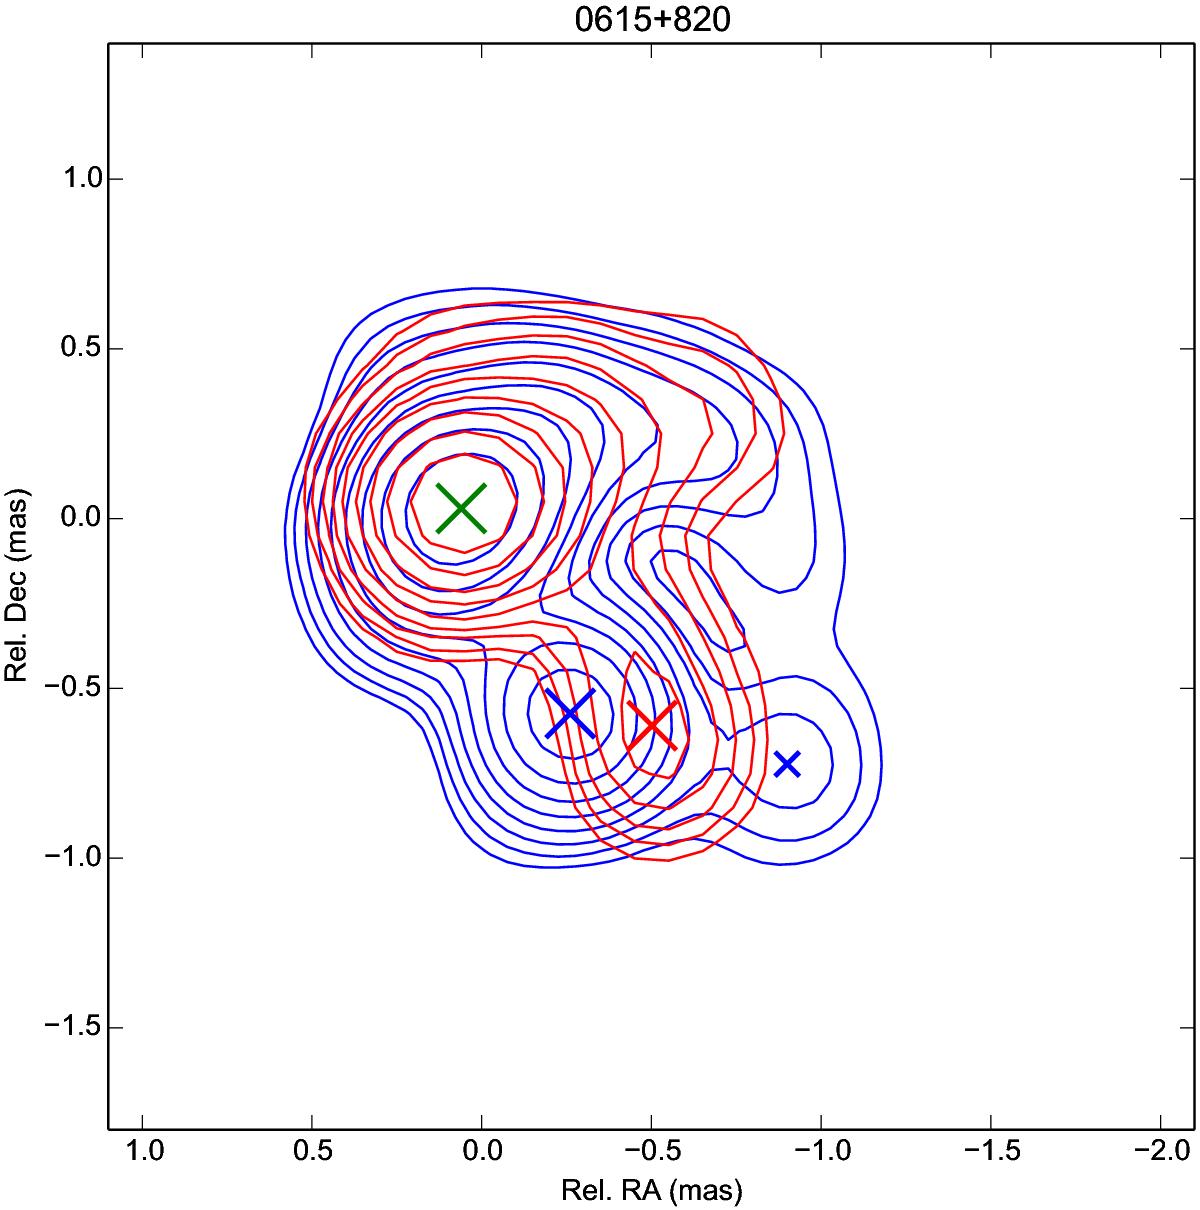
Source 06 at the 15 GHz band in the year 2000 (blue contours) and 2010 (red contours). The restoring beam is 0.4 × 0.4 mas and the ten contours are spaced logarithmically from 5% to 99% of the peak intensities (0.15 and 0.27 Jy/beam for year 2000 and 2010, respectively). The red and blue crosses indicate the position of the SW component in 2010 and 2000 (respectively). The green cross shows the location of the NE component (set equal in both epochs). A second peak at west of SW in the year 2000 is also shown by a smaller blue cross.
Current usage metrics show cumulative count of Article Views (full-text article views including HTML views, PDF and ePub downloads, according to the available data) and Abstracts Views on Vision4Press platform.
Data correspond to usage on the plateform after 2015. The current usage metrics is available 48-96 hours after online publication and is updated daily on week days.
Initial download of the metrics may take a while.