Fig. 8
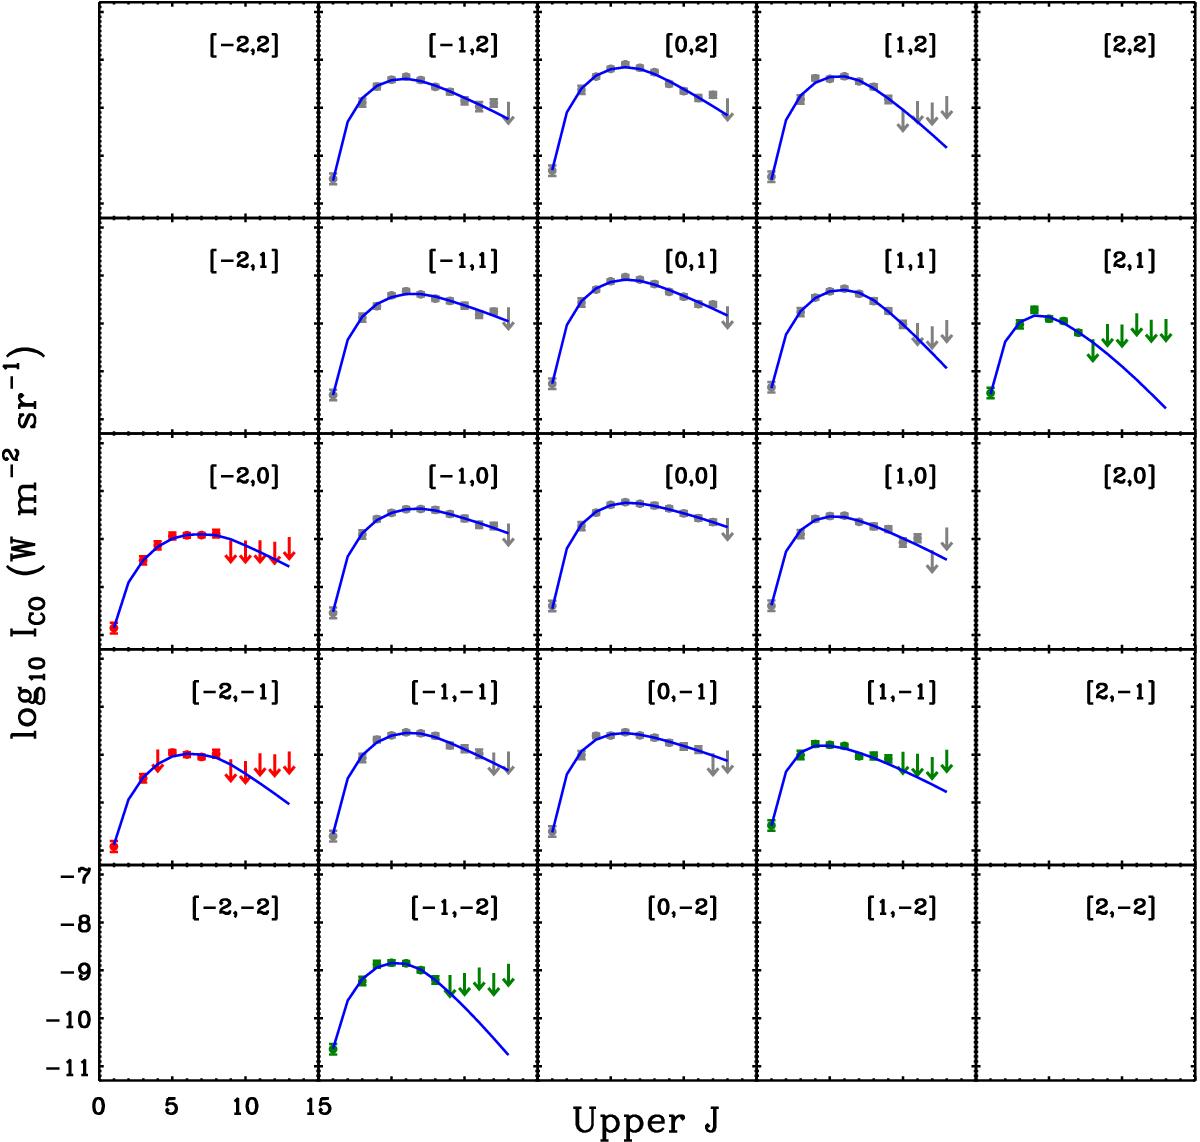
CO SLEDs for Ju = 1,...,13 (Ju = 2 not included). In this image, the pixels correspond to the individual data points (30′′ in size) in our FTS maps at 42′′ resolution and the pair of numbers in the top right corner of each pixel shows a location of the pixel relative to the center of the FTS coverage ([0,0] is [RA, Dec] = [05h39m37s, − 69°46′13′′]). The circles represent detected CO transitions and the downward arrows show upper limits based on 5σs. Most of the observed CO SLEDs show peak at Ju ≥ 6 (gray), while some pixels have peaks that are uncertain (red) or occur at the transitions lower than Ju = 6 (green). Finally, the best-fit RADEX models determined in Sect. 4.2 are overlaid in blue.
Current usage metrics show cumulative count of Article Views (full-text article views including HTML views, PDF and ePub downloads, according to the available data) and Abstracts Views on Vision4Press platform.
Data correspond to usage on the plateform after 2015. The current usage metrics is available 48-96 hours after online publication and is updated daily on week days.
Initial download of the metrics may take a while.