Fig. 7
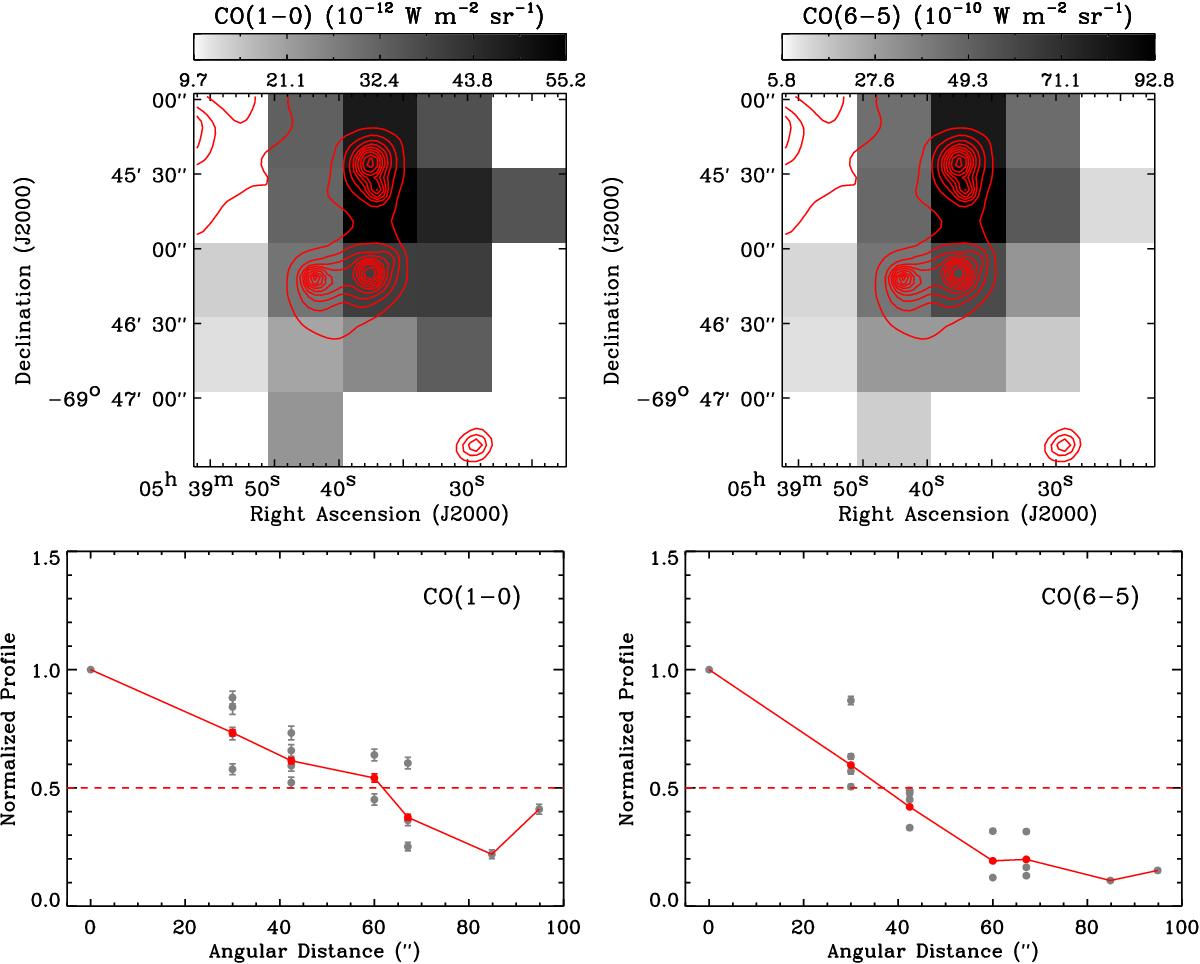
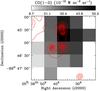
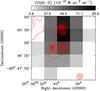
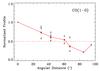
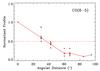
Top left: CO(1–0) integrated intensity image at 45′′ resolution. The Spitzer 24 μm emission at its original resolution of 6′′ is overlaid in red with contour levels ranging from 10% to 90% of the peak (2149 MJy sr-1) in 10% steps. Top right: same as the top left panel, but for CO(6–5). Bottom left: normalized CO(1–0) integrated intensity as a function of angular distance from its peak at (RA, Dec) = (05h39m37s, −69°45′43′′). The individual pixel values are shown as the gray circles and the (1/![]() )-weighted mean values are overplotted as the red circles when there is more than one data point in each angular distance bin. Bottom right: same as the bottom left panel, but for CO(6–5).
)-weighted mean values are overplotted as the red circles when there is more than one data point in each angular distance bin. Bottom right: same as the bottom left panel, but for CO(6–5).
Current usage metrics show cumulative count of Article Views (full-text article views including HTML views, PDF and ePub downloads, according to the available data) and Abstracts Views on Vision4Press platform.
Data correspond to usage on the plateform after 2015. The current usage metrics is available 48-96 hours after online publication and is updated daily on week days.
Initial download of the metrics may take a while.