Fig. 3
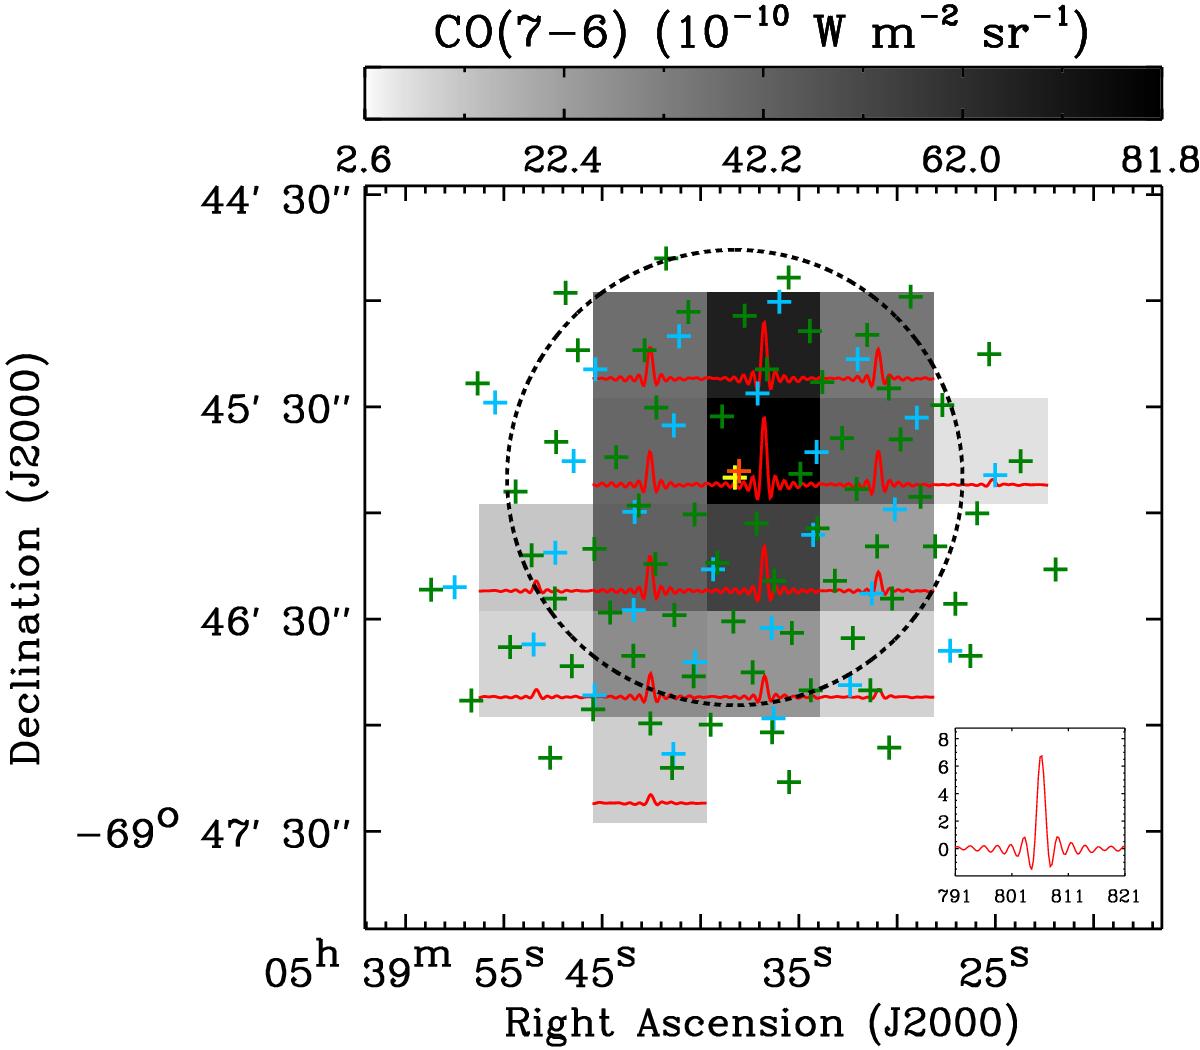
CO(7–6) integrated intensity image at 42′′ resolution (pixel size = 30′′). In our FTS observations, CO(7–6) is one of the most sensitive transitions with the lowest median statistical uncertainty (σs,med; Table 1). The SLW and SSW arrays are shown as the blue and green crosses, except the central detectors for the first jiggle observation (SLWC3 and SSWD4) in yellow and orange. The spectra with the statistical signal-to-noise ratio S/Ns (integrated intensity divided by σs) > 5 are presented in red (our threshold for detection; Sect. 3.1) and their x-axis (in GHz) and y-axis (in 10-18 W m-2 Hz-1 sr-1) ranges are shown in the bottom right corner with the spectrum of the pixel observed with SLWC3 and SSWD4. The black dashed circle delineates the 2′ unvignetted field-of-view for FTS observations and almost all pixels are within this field-of-view. Note that we do have a spectrum for every detector and the blank pixels within the SLW coverage in the current image simply result from the rebinning process.
Current usage metrics show cumulative count of Article Views (full-text article views including HTML views, PDF and ePub downloads, according to the available data) and Abstracts Views on Vision4Press platform.
Data correspond to usage on the plateform after 2015. The current usage metrics is available 48-96 hours after online publication and is updated daily on week days.
Initial download of the metrics may take a while.