Fig. 17
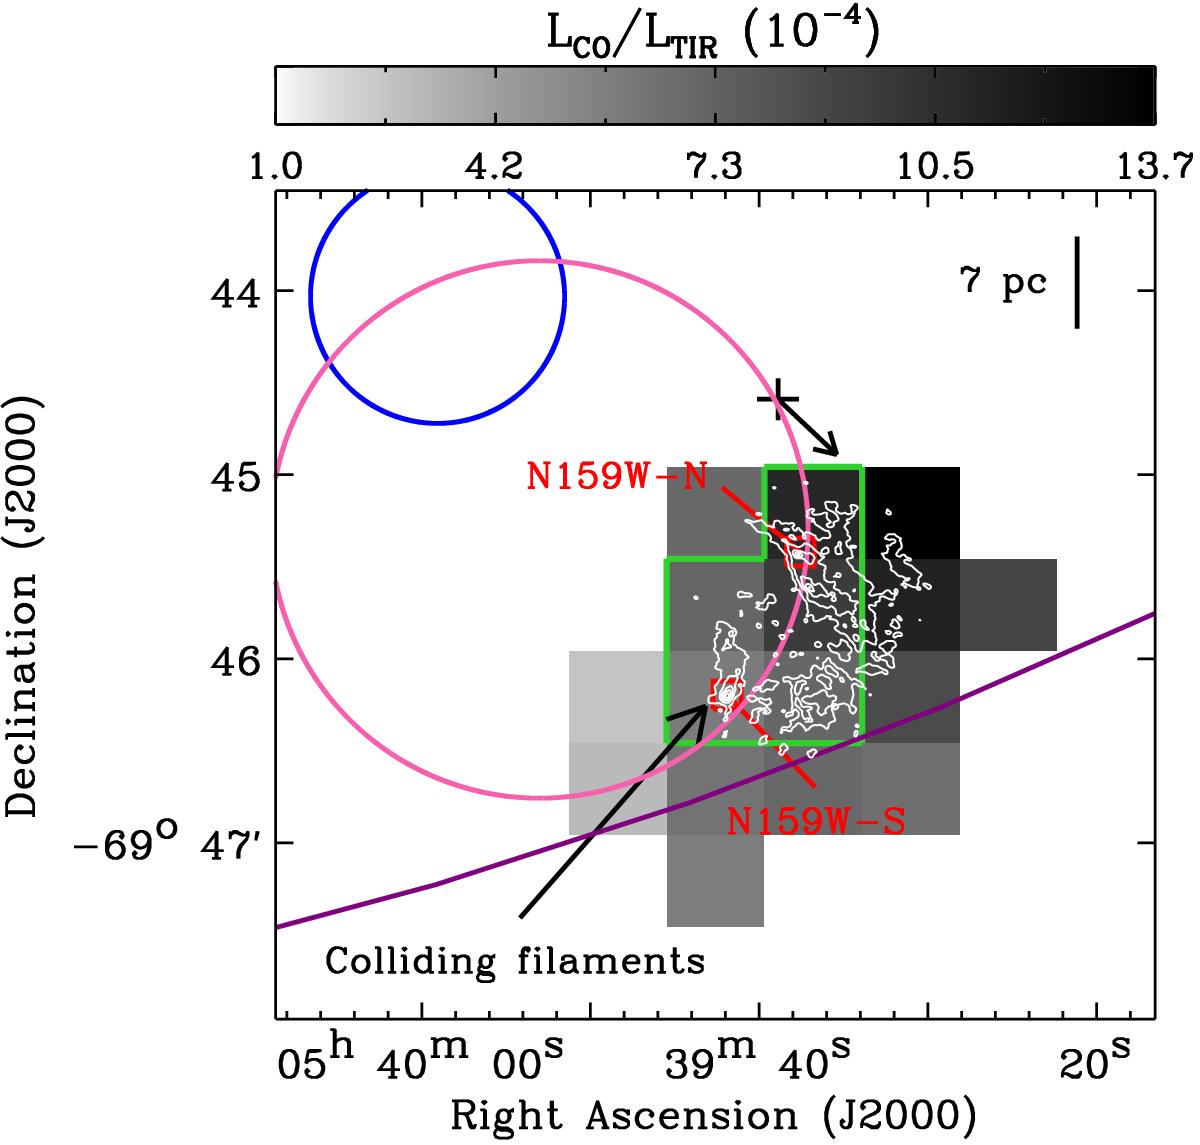
Possible shock drivers overlaid on the LCO/LTIR image (Sect. 5.3.4 for details). (1) LMC X-1 and its proposed jet (black cross and arrow; the angle of the jet was estimated by Cooke et al. 2007); (2) SNR J0540.0−6944 (blue circle; the diameter corresponds to the size of ~19 pc measured by Williams et al. 2000); (3) protostellar outflows (red squares; N159W-N and N159W-S); (4) colliding filaments; (5) SGS 19 (purple circle; this HI supergiant shell cataloged by Kim et al. 1999 is only partially shown here); and (6) wind-blown bubble (pink circle; the diameter is ~40 pc, as suggested by Jones et al. 2005). The ALMA CO(2–1) observations on ~1′′ scales where the protostellar outflows and the colliding filaments were identified (Fukui et al. 2015) are shown as the white contours with levels ranging from 10% to 90% of the peak (29 Jy Beam-1) in 20% steps. The five pixels used in our Meudon PDR modeling (Sect. 5.1.1) are also outlined in green.
Current usage metrics show cumulative count of Article Views (full-text article views including HTML views, PDF and ePub downloads, according to the available data) and Abstracts Views on Vision4Press platform.
Data correspond to usage on the plateform after 2015. The current usage metrics is available 48-96 hours after online publication and is updated daily on week days.
Initial download of the metrics may take a while.