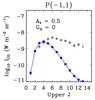
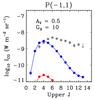
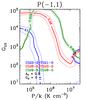
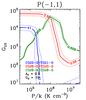
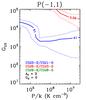
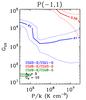
Fig. 15
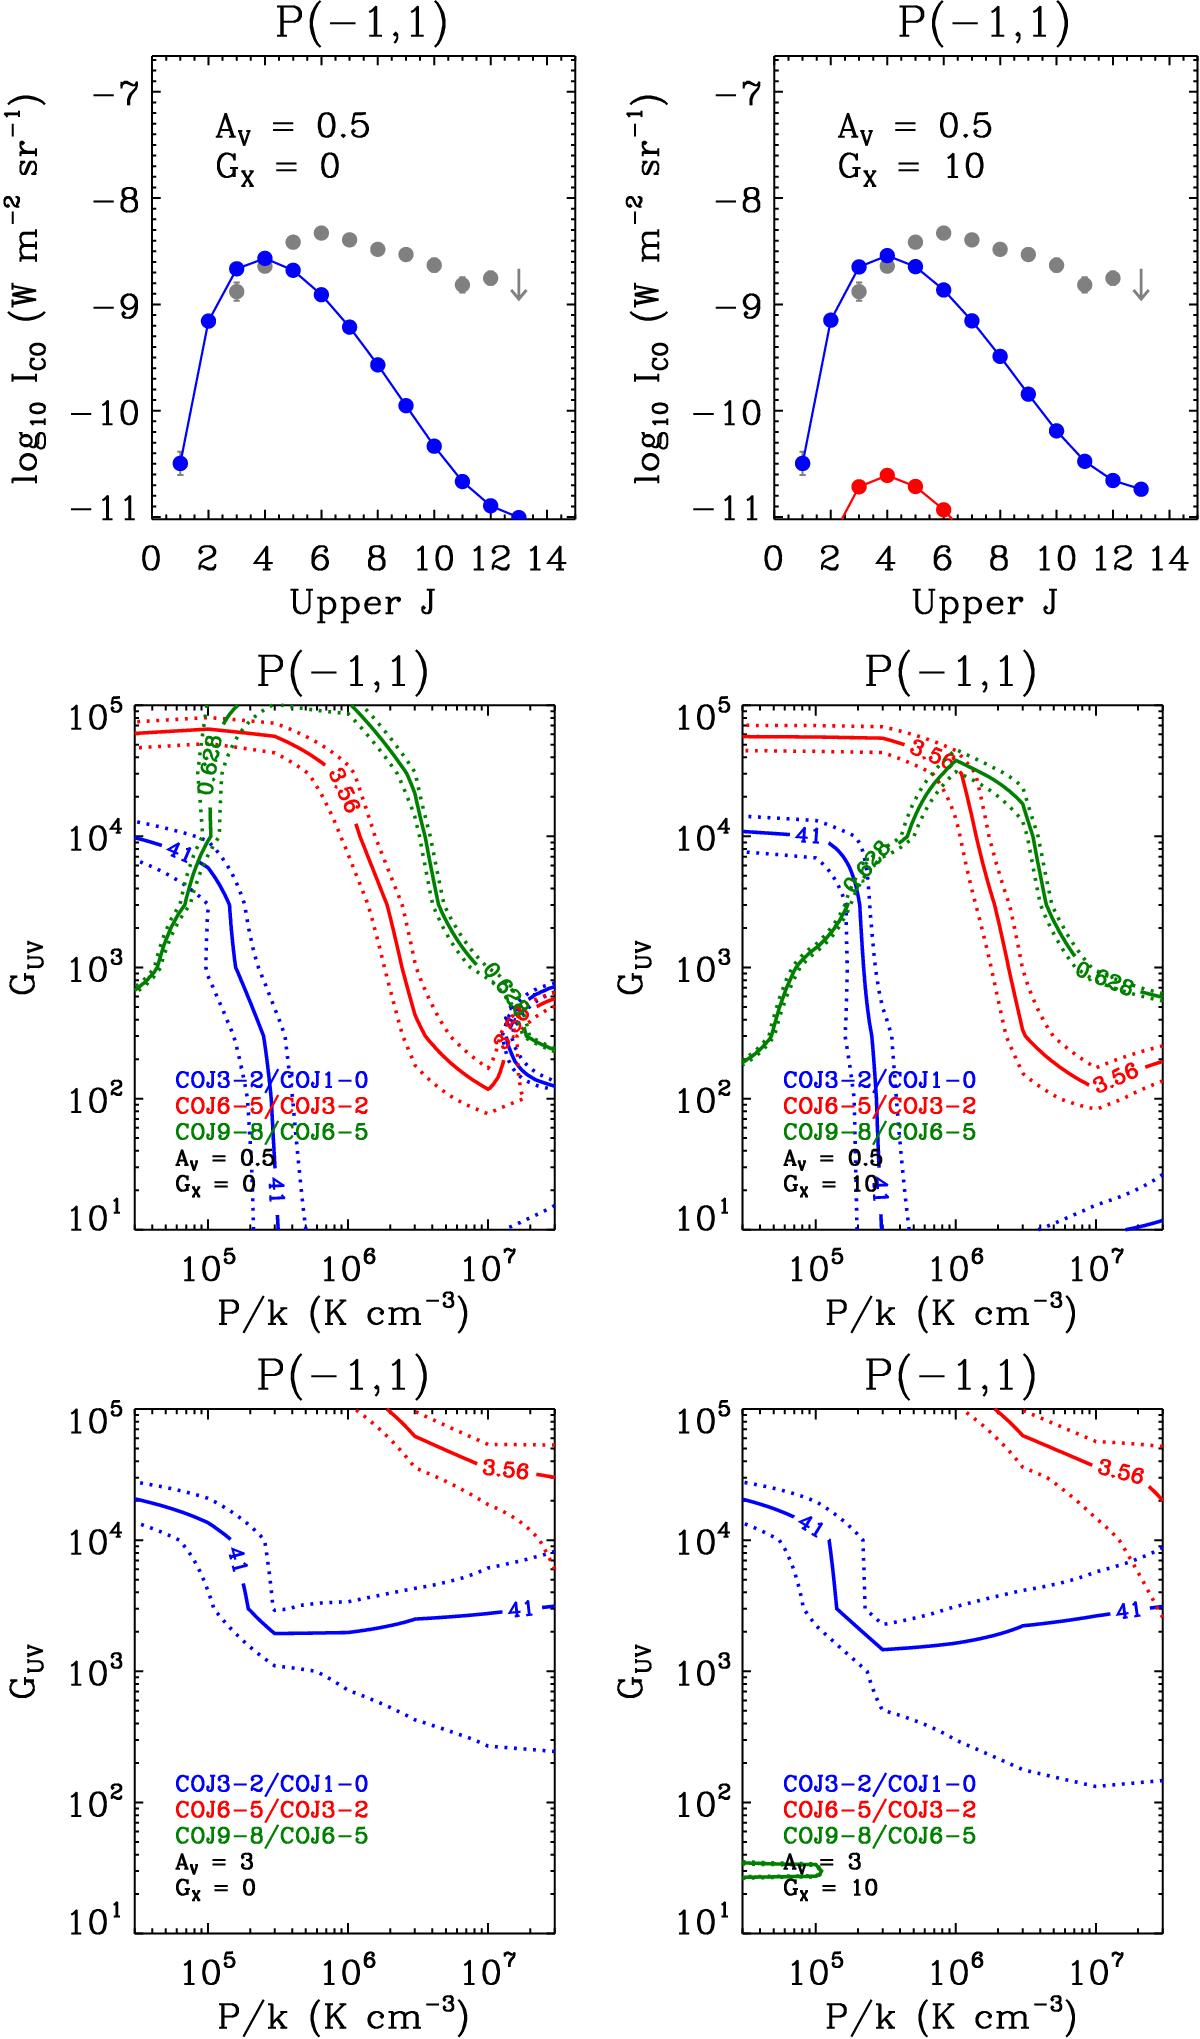
Meudon PDR modeling of CO lines. As in Fig. 14, all plots presented here are for the region at (RA, Dec) = (05h39m43s,−69°45′43′′) ([−1, 1] in Figs. 8 and 12). The left and right panels are for GX = 0 and GX = 10 respectively. Top: CO SLEDs: observations (gray) vs. model predictions (red). The CO predictions are from the best-fit solutions in the top panels of Fig. 14 and are too low to be shown for GX = 0. For an easy comparison with the observed SLEDs, the model SLEDs are also scaled to match the CO(1–0) integrated intensities and are presented in blue. Middle: model results for the line ratios (AV = 0.5 mag): CO(3–2)/CO(1–0) (blue), CO(6–5)/CO(3–2) (red), and CO(9–8)/CO(6–5) (green). Each of the observed line ratios is shown as the solid line, while the 1σ uncertainty is the dotted line. Note that the circular contours in the middle left plot at P/k> 107 K cm-3 and GUV ~ 500 are artifacts due to the unavailability of model predictions over the corresponding parameter space. Bottom: same as the middle panels, but with AV = 3 mag. Likewise, the ellipsoidal contour in the bottom right plot at P/k< 105 K cm-3 and GUV ~ 30 is simply an artifact. Note that the observed CO(9–8)/CO(6–5) ratio is not reproduced over the entire parameter space.
Current usage metrics show cumulative count of Article Views (full-text article views including HTML views, PDF and ePub downloads, according to the available data) and Abstracts Views on Vision4Press platform.
Data correspond to usage on the plateform after 2015. The current usage metrics is available 48-96 hours after online publication and is updated daily on week days.
Initial download of the metrics may take a while.