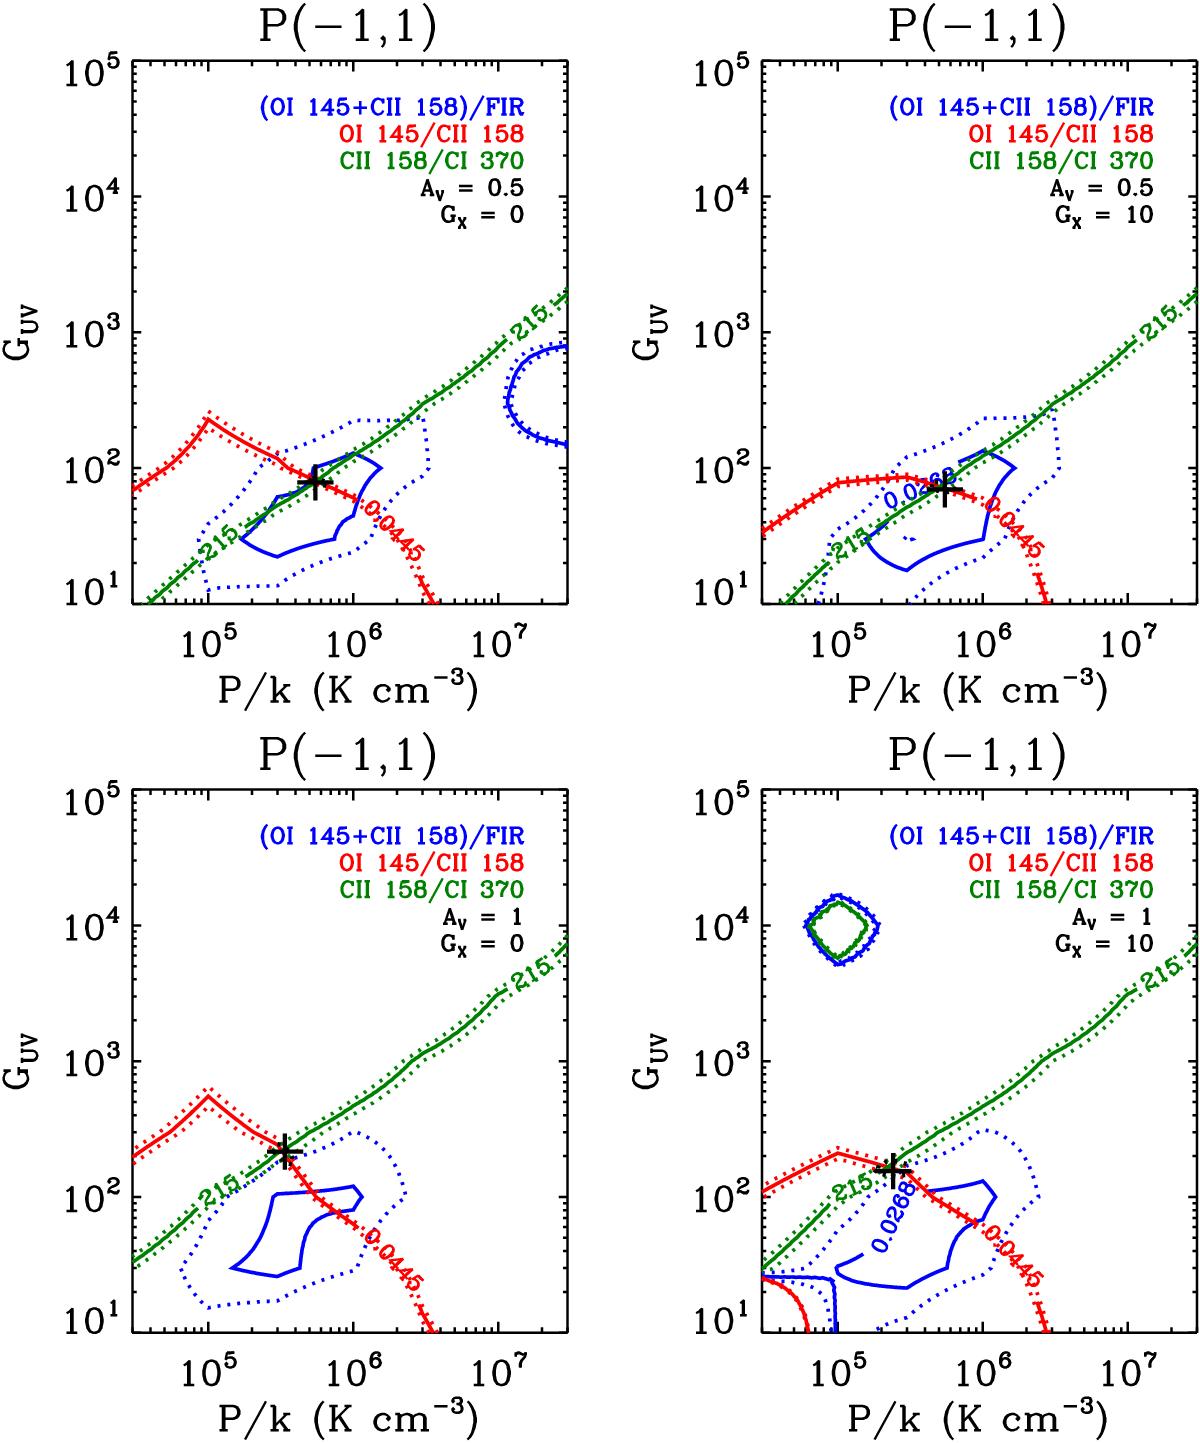
Fig. 14

Meudon PDR modeling of ([OI] 145 μm+[CII] 158 μm)/FIR luminosity (blue), [OI] 145 μm/[CII] 158 μm (red), and [CII] 158 μm/[CI] 370 μm (green). This particular example is for the region at (RA, Dec) = (05h39m43s, −69°45′43′′), which corresponds to the pixel [−1, 1] in Figs. 8 and 12. Each of the observed line ratios is shown as the solid line, while the 1σ uncertainty is in dotted line. The best-fit solution with the minimum χ2 is indicated as the black cross. Finally, the following model parameters are used for each plot: AV = 0.5 mag and GX = 0 (top left), AV = 0.5 mag and GX = 10 (top right), AV = 1 mag and GX = 0 (bottom left), and AV = 1 mag and GX = 10 (bottom right). Note that the circular contours in the top left (P/k> 107 K cm-3 and GUV ~ 500) and bottom right (P/k ~ 105 K cm-3 and GUV ~ 104) plots are artifacts due to the unavailability of model predictions over the corresponding parameter ranges.
Current usage metrics show cumulative count of Article Views (full-text article views including HTML views, PDF and ePub downloads, according to the available data) and Abstracts Views on Vision4Press platform.
Data correspond to usage on the plateform after 2015. The current usage metrics is available 48-96 hours after online publication and is updated daily on week days.
Initial download of the metrics may take a while.


