Fig. 13
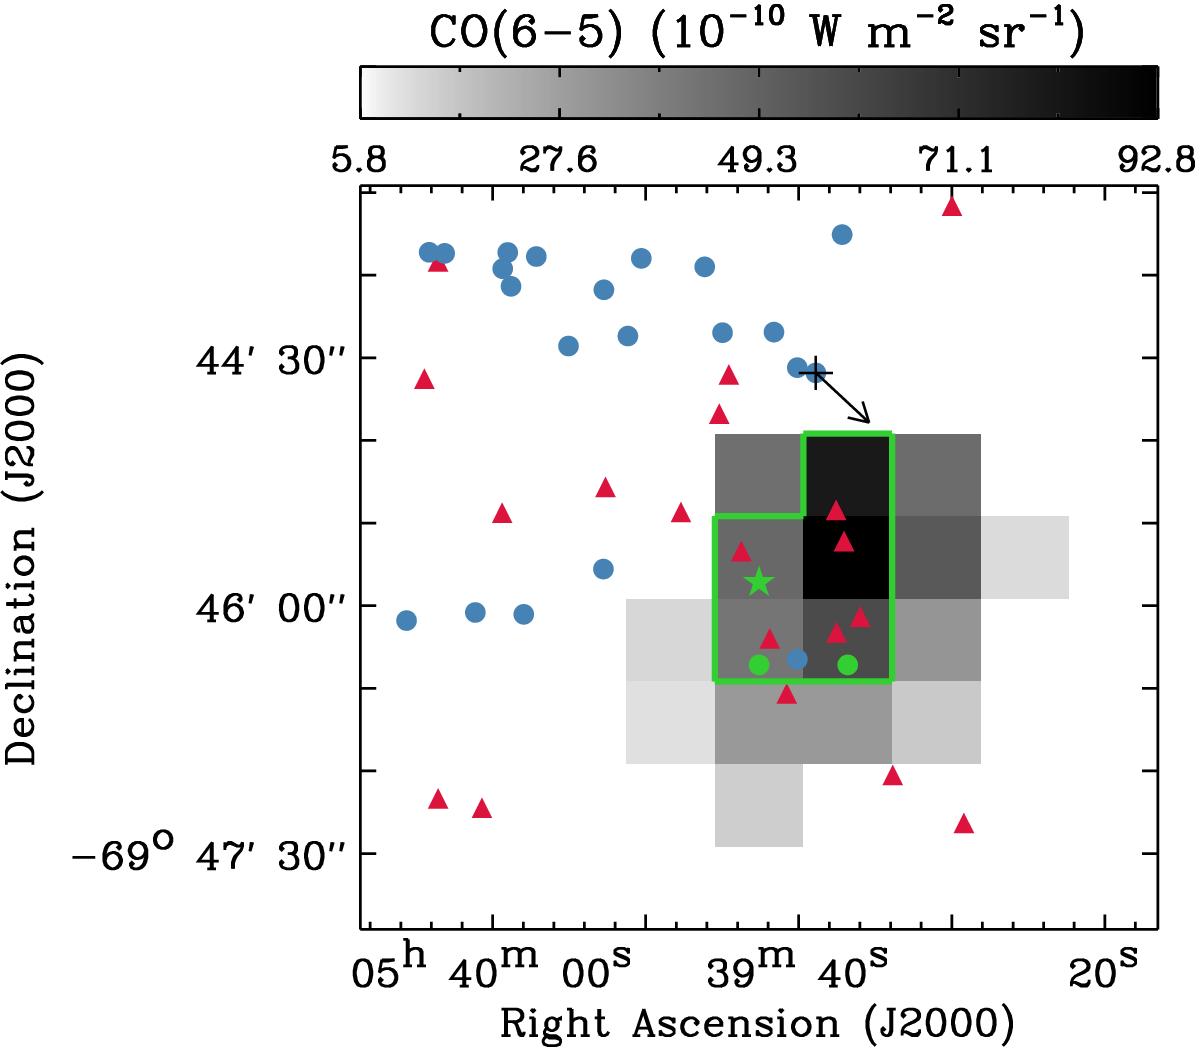
UV and X-ray heating sources on the CO(6–5) integrated intensity image. Massive YSOs from Chen et al. (2010) are shown as the red triangles, while spectroscopically identified early-type stars from Fariña et al. (2009) are overlaid as the blue circles. The black cross and arrow indicate LMC X-1 and the orientation of its jet (Cooke et al. 2007). Finally, the five pixels used for our PDR modeling are outlined in green. The pixel indicated with the green star is the one presented in Figs. 14 and 15 and the two other pixels with the green circles are the regions where particularly large discrepancies with the PDR model are found (Sect. 5.1.2).
Current usage metrics show cumulative count of Article Views (full-text article views including HTML views, PDF and ePub downloads, according to the available data) and Abstracts Views on Vision4Press platform.
Data correspond to usage on the plateform after 2015. The current usage metrics is available 48-96 hours after online publication and is updated daily on week days.
Initial download of the metrics may take a while.