Fig. 10
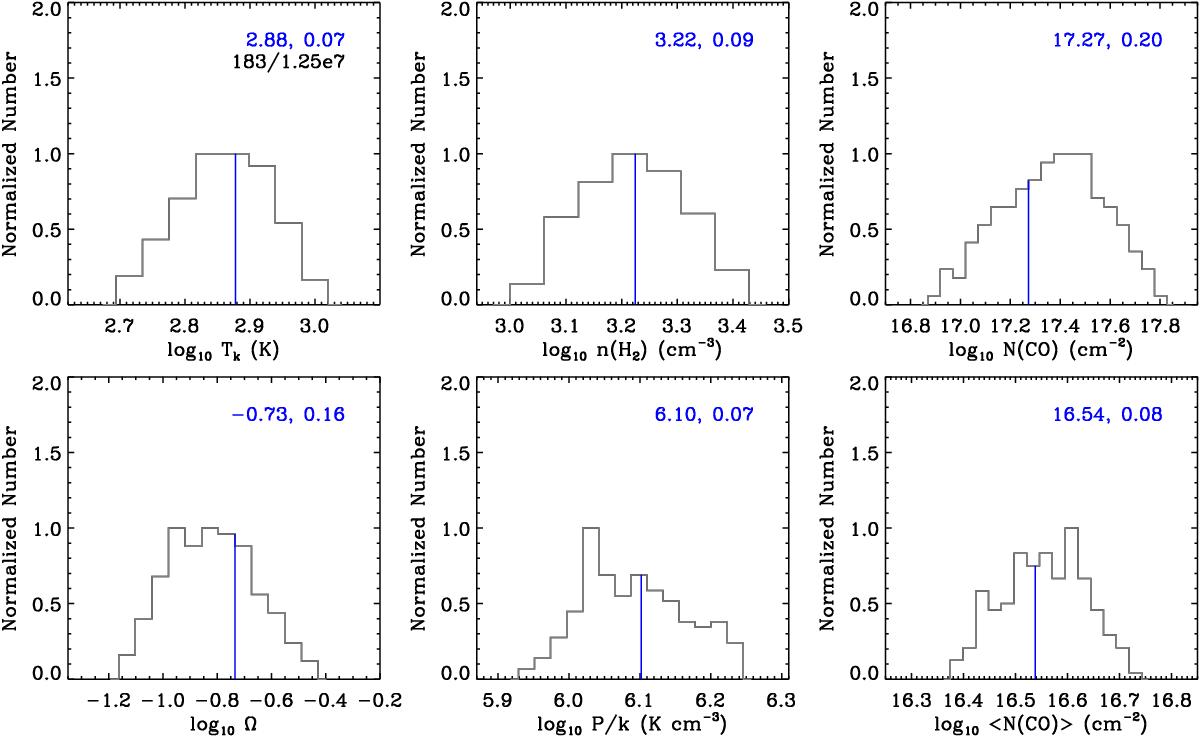
Histograms of “good” parameters for the central pixel of our FTS maps ([0,0] in Fig. 8; [RA, Dec] = [05h39m37s, − 69°46′13′′]). To derive these histograms, the threshold of χ2≤ minimum χ2 + 4.7 is applied to the calculated χ2 distribution. Along with the log value of the best-fit parameter, the standard deviation of the χ2 distribution measured in log space are shown in blue in the top right corner of each plot. The corresponding blue line of each histogram represents the best-fit parameter. Finally, the number in black in the Tk plot is the ratio of the number of “good” models to the total number of RADEX models in our study. See Sect. 4.2 for details.
Current usage metrics show cumulative count of Article Views (full-text article views including HTML views, PDF and ePub downloads, according to the available data) and Abstracts Views on Vision4Press platform.
Data correspond to usage on the plateform after 2015. The current usage metrics is available 48-96 hours after online publication and is updated daily on week days.
Initial download of the metrics may take a while.