Fig. 1
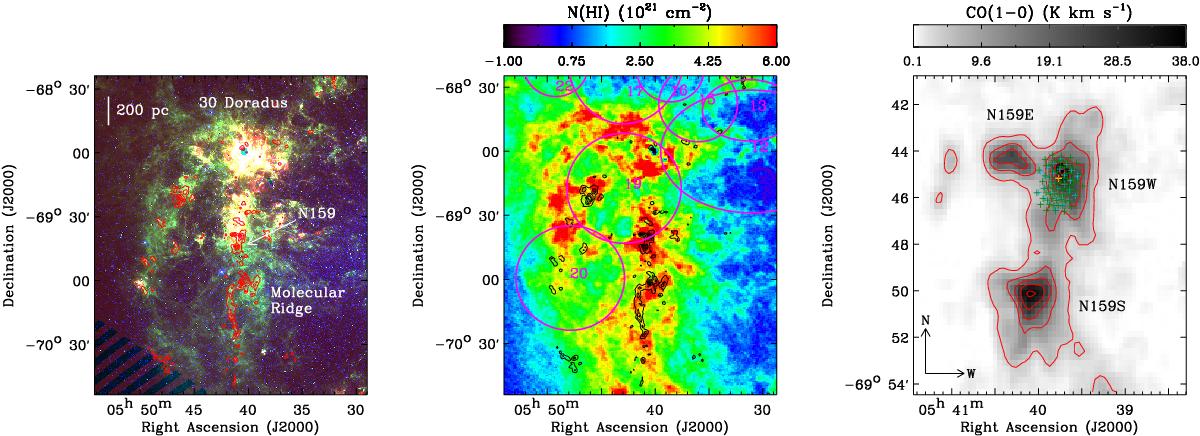
Left panel: three-color composite image of the HII region complex N159 and its surrounding environment (Spitzer 3.6 μm/8 μm/24 μm in blue/green/red; Meixner et al. 2006). The CO(1–0) integrated intensity from the MAGMA survey (Wong et al. 2011) is shown as the red contours with levels ranging from 10% to 90% of the peak (39.5 K km s-1) in 20% steps. Middle panel: HI column density image from Kim et al. (1998) with the same MAGMA CO contours as shown in the left panel (now in black). Several of the supergiant HI shells, identified by Kim et al. (1999) (clockwise from left: SGSs 22, 17, 16, 15, 13, 12, 19, and 20), are shown as the purple circles. This large-scale HI structure, where the molecular ridge is embedded, corresponds to the southeastern HI overdensity region in the LMC. Right panel: CO(1–0) integrated intensity image of N159 with the same contours as presented in the left panel. The locations of the SLW and SSW detectors are shown as the blue and green crosses, while the central detectors for the first jiggle observation (SLWC3 and SSWD4) are in yellow and orange. All these detectors are also shown in Fig. 3. Finally, the three prominent sub-regions in N159 are labeled.
Current usage metrics show cumulative count of Article Views (full-text article views including HTML views, PDF and ePub downloads, according to the available data) and Abstracts Views on Vision4Press platform.
Data correspond to usage on the plateform after 2015. The current usage metrics is available 48-96 hours after online publication and is updated daily on week days.
Initial download of the metrics may take a while.