Fig. 6
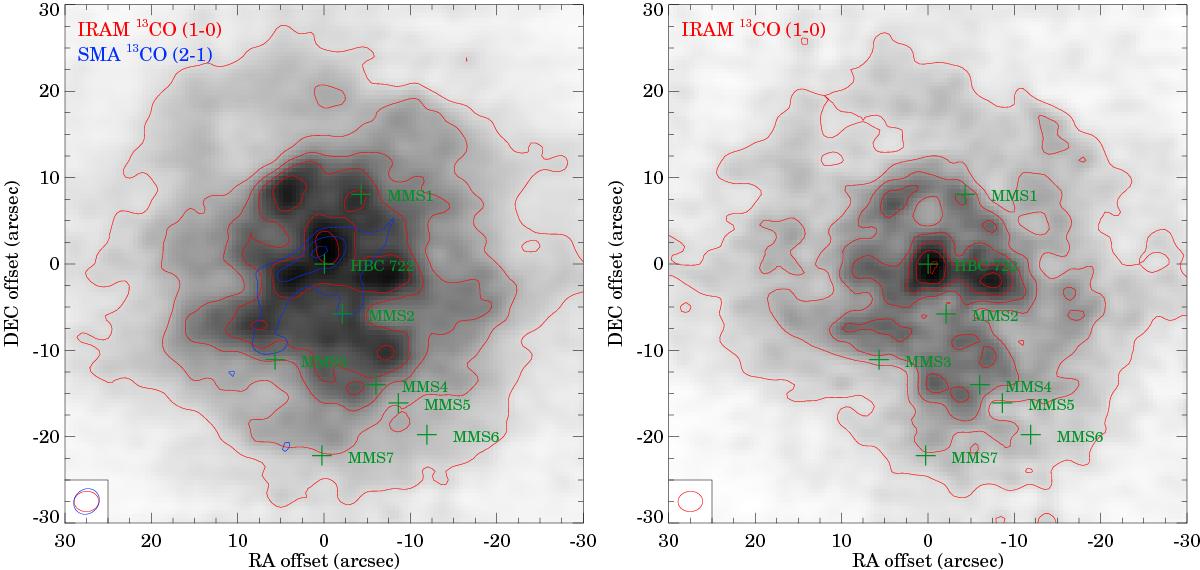
Left: total intensity of the 13CO emission in the area around HBC 722, integrated for the 0–9 km s-1 velocity range. The grayscale image and the red contours are IRAM PdBI+30 m observations from this work, while the blue contours are SMA data from Dunham et al. (2012). For the 13CO(1–0) line, contours are displayed at 4, 8, 12, ...σ, with σ = 0.09 Jy km s-1, while for the 13CO(2–1) line, contours are at 4, 8, 12, ...σ, with σ = 0.3 Jy km s-1. Right: total intensity of the 13CO emission in the area around HBC 722, integrated for the 5.46–6.52 km s-1 velocity range. Contours are at 4, 8, 12, ...σ, with σ = 0.03 Jy km s-1.
Current usage metrics show cumulative count of Article Views (full-text article views including HTML views, PDF and ePub downloads, according to the available data) and Abstracts Views on Vision4Press platform.
Data correspond to usage on the plateform after 2015. The current usage metrics is available 48-96 hours after online publication and is updated daily on week days.
Initial download of the metrics may take a while.