Fig. 4
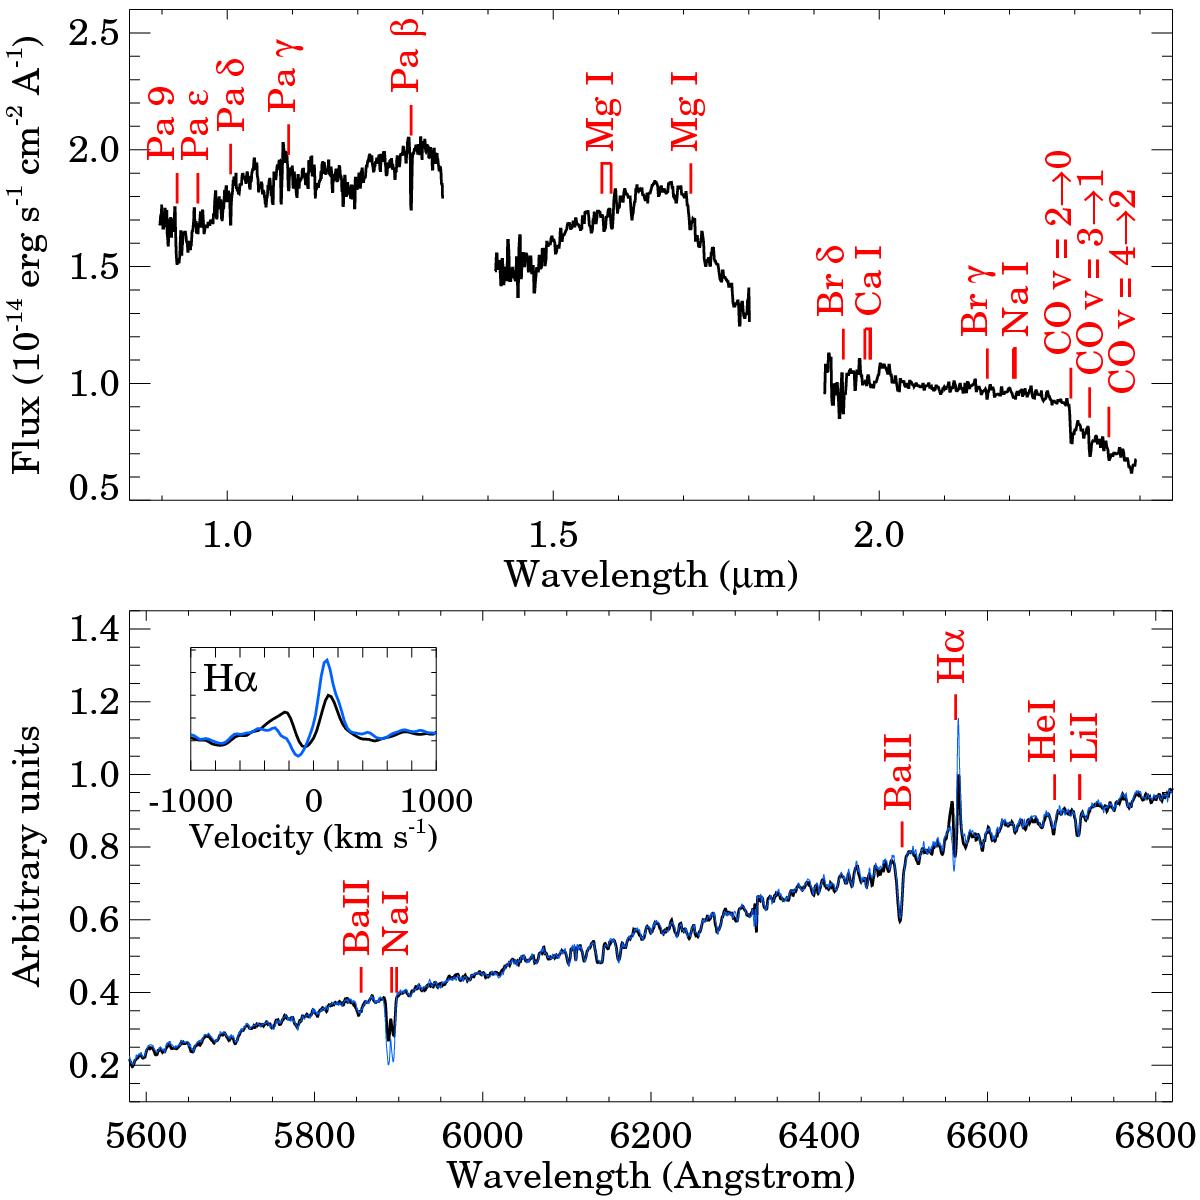
Top panel: near-IR spectrum of HBC 722 obtained with WHT/LIRIS on 2011 July 21. To guide the eye, the vertical red bars show the laboratory wavelengths of atomic and molecular features typical for young stars. Bottom panel: optical spectra of HBC 722 obtained with GTC/OSIRIS on 2012 April 17 (blue curve) and 2013 July 10 (black curve). The inset shows the Hα line in more details as a function of the velocity. The identified lines are marked in red above the optical spectra.
Current usage metrics show cumulative count of Article Views (full-text article views including HTML views, PDF and ePub downloads, according to the available data) and Abstracts Views on Vision4Press platform.
Data correspond to usage on the plateform after 2015. The current usage metrics is available 48-96 hours after online publication and is updated daily on week days.
Initial download of the metrics may take a while.