Fig. 1
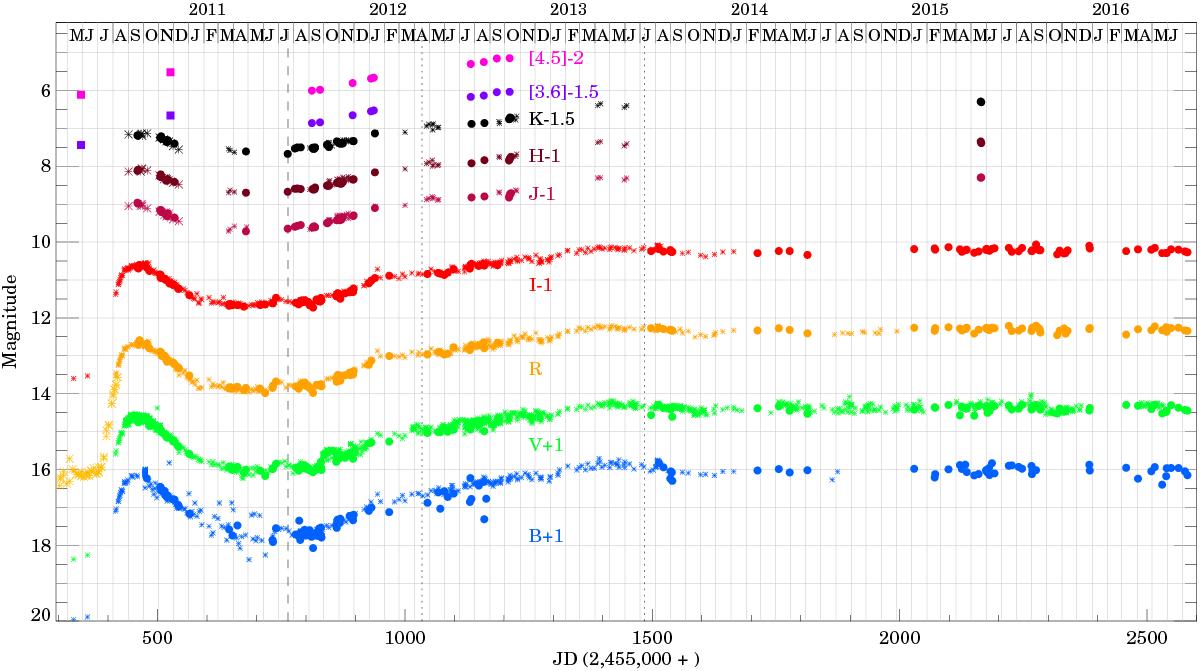
Light curves of HBC 722. Filled dots are from Paper I and this work, plus signs are from Semkov et al. (2010), Semkov et al. (2014), Miller et al. (2011), Sung et al. (2013), Antoniucci et al. (2013), and from the AAVSO database1. Mid-IR data points are either from WISE (filled squares) or from Spitzer (filled dots). For clarity, the B, V, I, J, H, KS, [3.6] and [4.5] light curves are shifted along the y-axis. The vertical dashed line marks the epoch when our near-IR LIRIS spectum was taken, while the vertical dotted lines indicate the time of our optical GTC/OSIRIS spectra.
Current usage metrics show cumulative count of Article Views (full-text article views including HTML views, PDF and ePub downloads, according to the available data) and Abstracts Views on Vision4Press platform.
Data correspond to usage on the plateform after 2015. The current usage metrics is available 48-96 hours after online publication and is updated daily on week days.
Initial download of the metrics may take a while.