Fig. 2
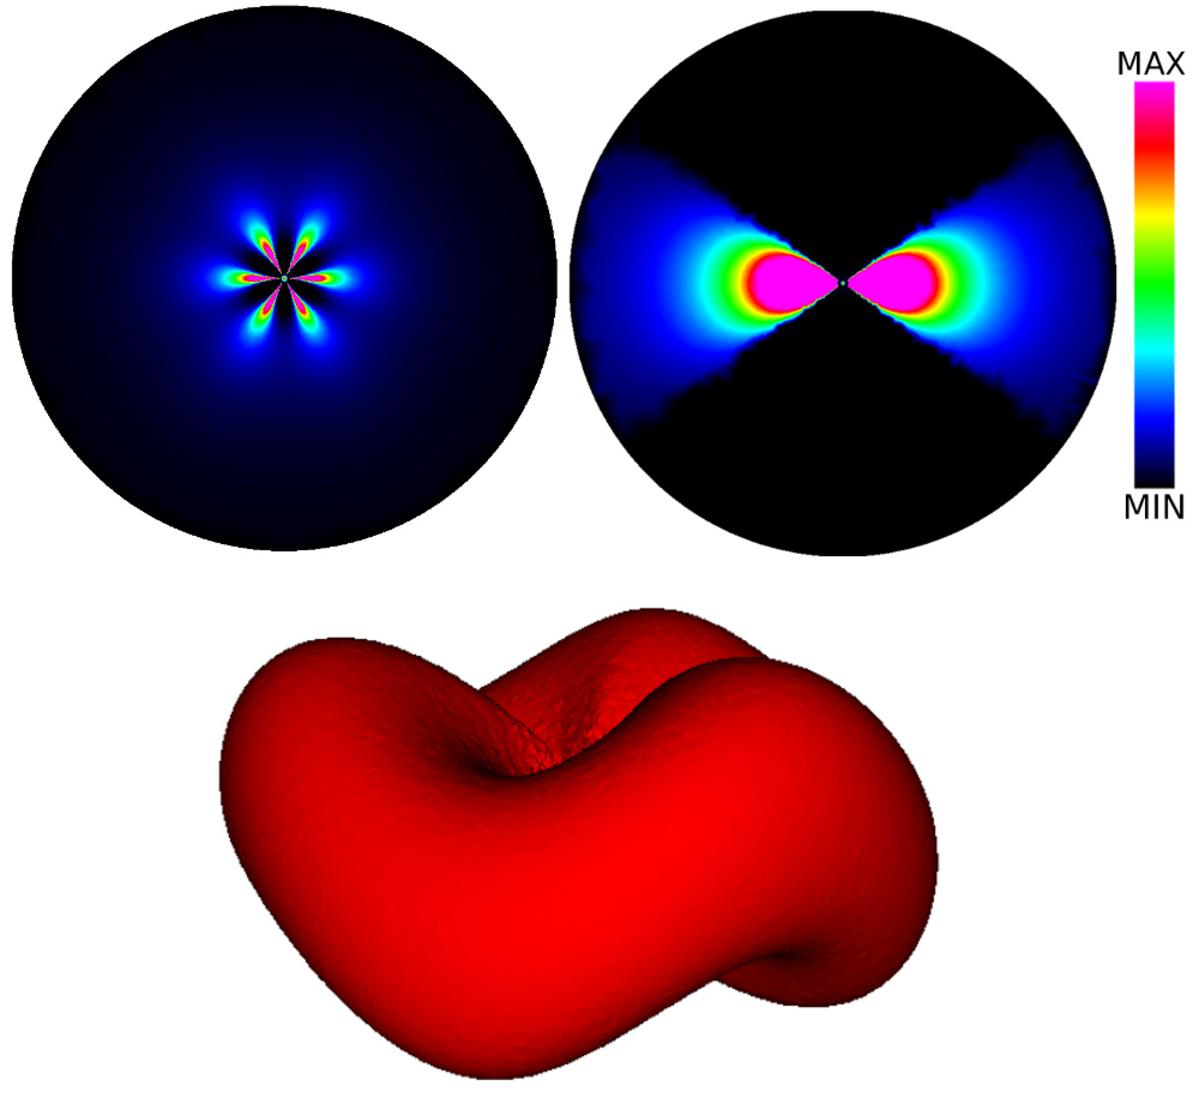
Visualisation of the density model of the warped EDE with three undulations. The top left pannel shows a cut through the equatorial plane, the top right pannel shows a cut through a meridional plane. The meaning of the colours is clarified by the linear colourbar on the right. MIN represents the minimum density in the models (in this case zero), and MAX has been chosen such as to enhance the visual appearance of the image. The bottom pannel shows a three-dimensional contour plot of the model.
Current usage metrics show cumulative count of Article Views (full-text article views including HTML views, PDF and ePub downloads, according to the available data) and Abstracts Views on Vision4Press platform.
Data correspond to usage on the plateform after 2015. The current usage metrics is available 48-96 hours after online publication and is updated daily on week days.
Initial download of the metrics may take a while.