Free Access
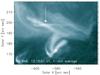
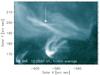
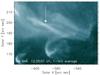
Fig. 5
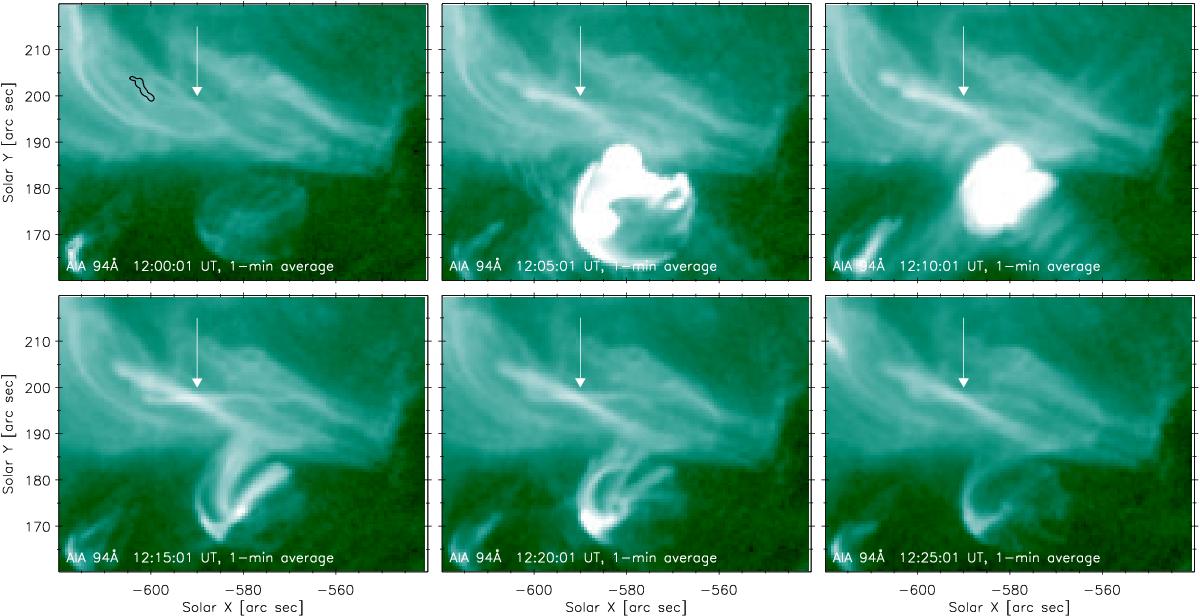
Evolution of the AIA 94 Å emission after the GREGOR observations. The white arrow indicates the Fe xviii loops, whose footpoints lie in the ribbon. The ribbon itself is shown by the black contour in the top left image. This contour corresponds to the 80 DN s-1 px-1 value in the IRIS SJI 1400 Å observation at 12:00 UT.
This figure is made of several images, please see below:
Current usage metrics show cumulative count of Article Views (full-text article views including HTML views, PDF and ePub downloads, according to the available data) and Abstracts Views on Vision4Press platform.
Data correspond to usage on the plateform after 2015. The current usage metrics is available 48-96 hours after online publication and is updated daily on week days.
Initial download of the metrics may take a while.