Free Access
Fig. 4
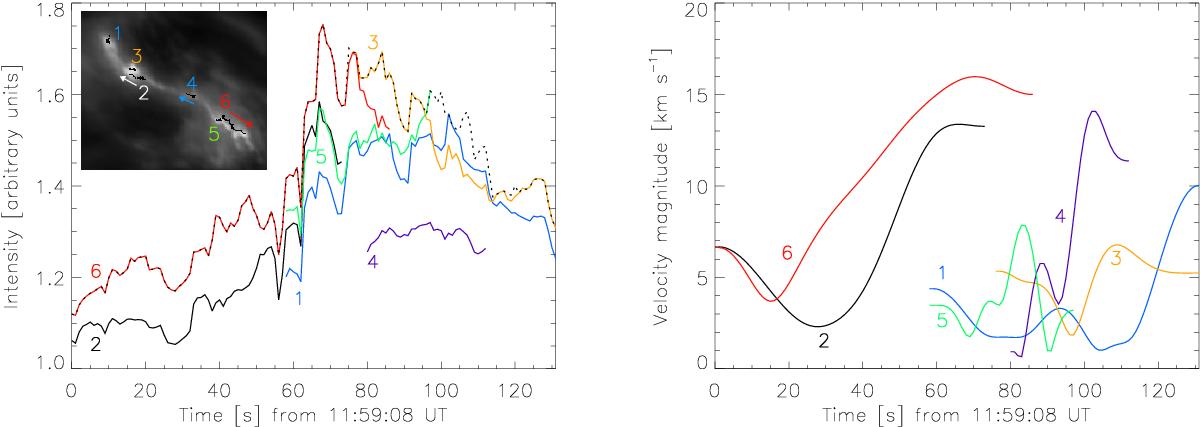
Intensities and horizontal velocities of bright knots 1–6. Left: light curves. The intensities are given in units of the initial intensity before the flare. The black dotted line represents the absolute intensity maximum in the ribbon. Right: low-pass-filtered instantaneous velocity magnitudes.
This figure is made of several images, please see below:
Current usage metrics show cumulative count of Article Views (full-text article views including HTML views, PDF and ePub downloads, according to the available data) and Abstracts Views on Vision4Press platform.
Data correspond to usage on the plateform after 2015. The current usage metrics is available 48-96 hours after online publication and is updated daily on week days.
Initial download of the metrics may take a while.