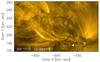
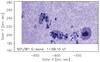
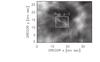
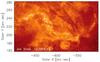
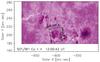
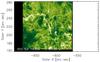
Fig. 1
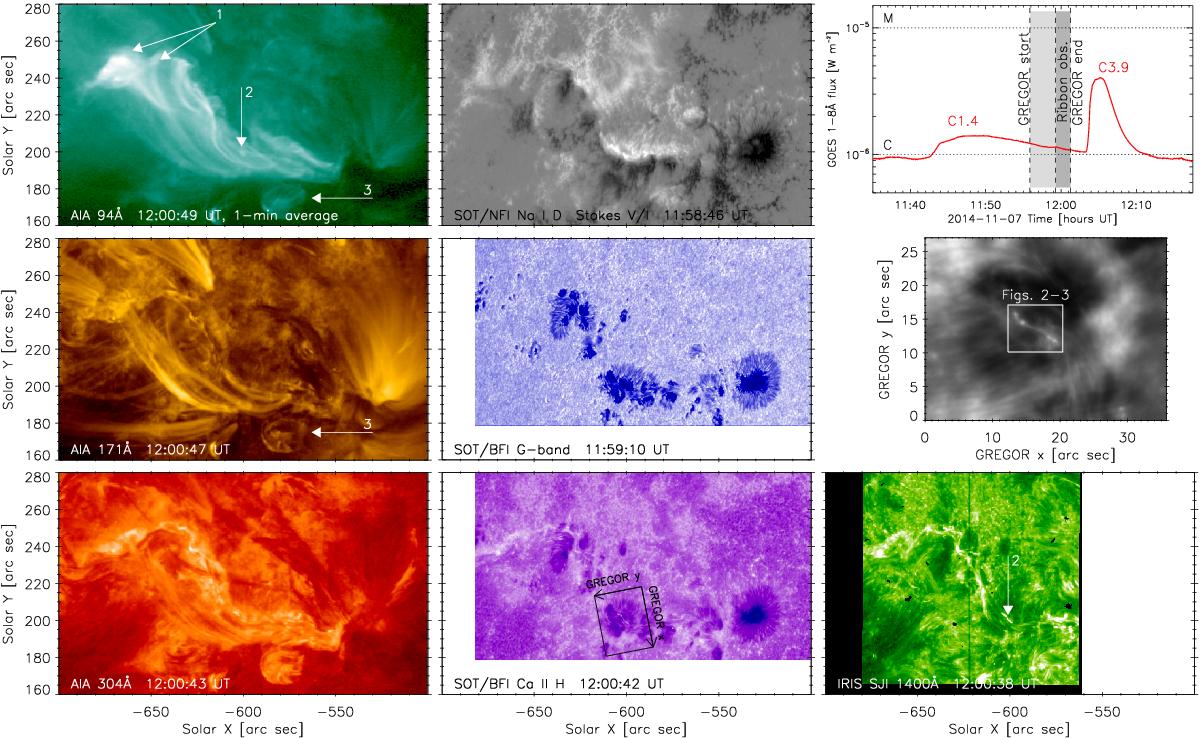
Context observations of AR 12205 from SDO/AIA (left), Hinode/SOT (middle), and the GOES X-ray flux, GREGOR Ca ii H, and IRIS 1400 Å slit-jaw image (right). Arrows 1–3 point to features discussed in the text. The GREGOR field of view, together with its axes, is shown as the black box in the bottom middle panel. The GREGOR axes are rotated and flipped with respect to the solar X and Y coordinates. The white box corresponds to the field of view shown in Figs. 2 and 3. The temporal evolution of the AIA 94 Å emission in the top left panel is shown in a movie available online.
Current usage metrics show cumulative count of Article Views (full-text article views including HTML views, PDF and ePub downloads, according to the available data) and Abstracts Views on Vision4Press platform.
Data correspond to usage on the plateform after 2015. The current usage metrics is available 48-96 hours after online publication and is updated daily on week days.
Initial download of the metrics may take a while.