Free Access
Fig. 8
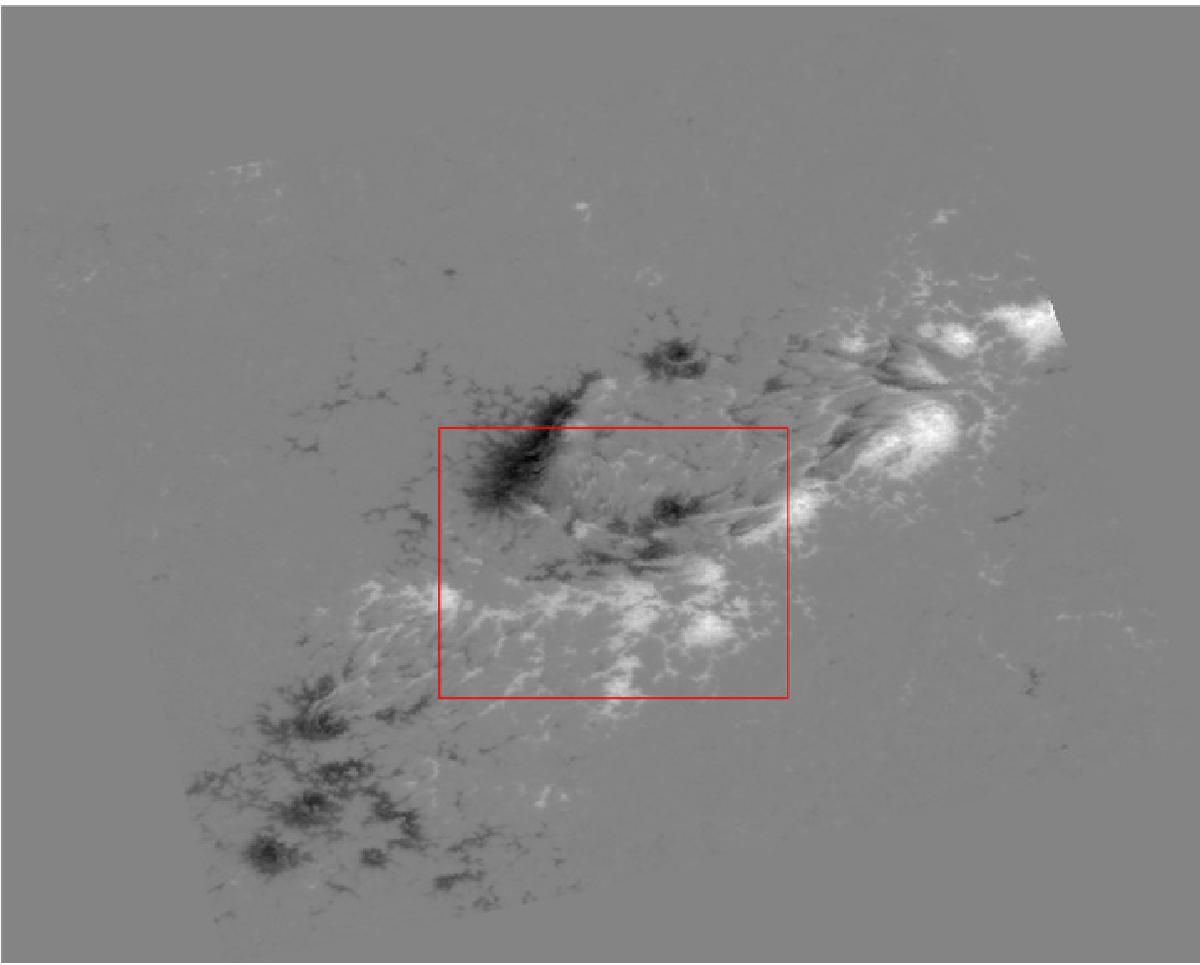
Hinode magnetogram of February 13, 2011 at 04:00 UT, after transforming the original 512 × 512 pixels image (with center at central meridian distance and latitude of −12.96° and −19.94° respectively) into heliographic coordinates, and area selected for analysis (red box).
Current usage metrics show cumulative count of Article Views (full-text article views including HTML views, PDF and ePub downloads, according to the available data) and Abstracts Views on Vision4Press platform.
Data correspond to usage on the plateform after 2015. The current usage metrics is available 48-96 hours after online publication and is updated daily on week days.
Initial download of the metrics may take a while.