Free Access
Fig. 5
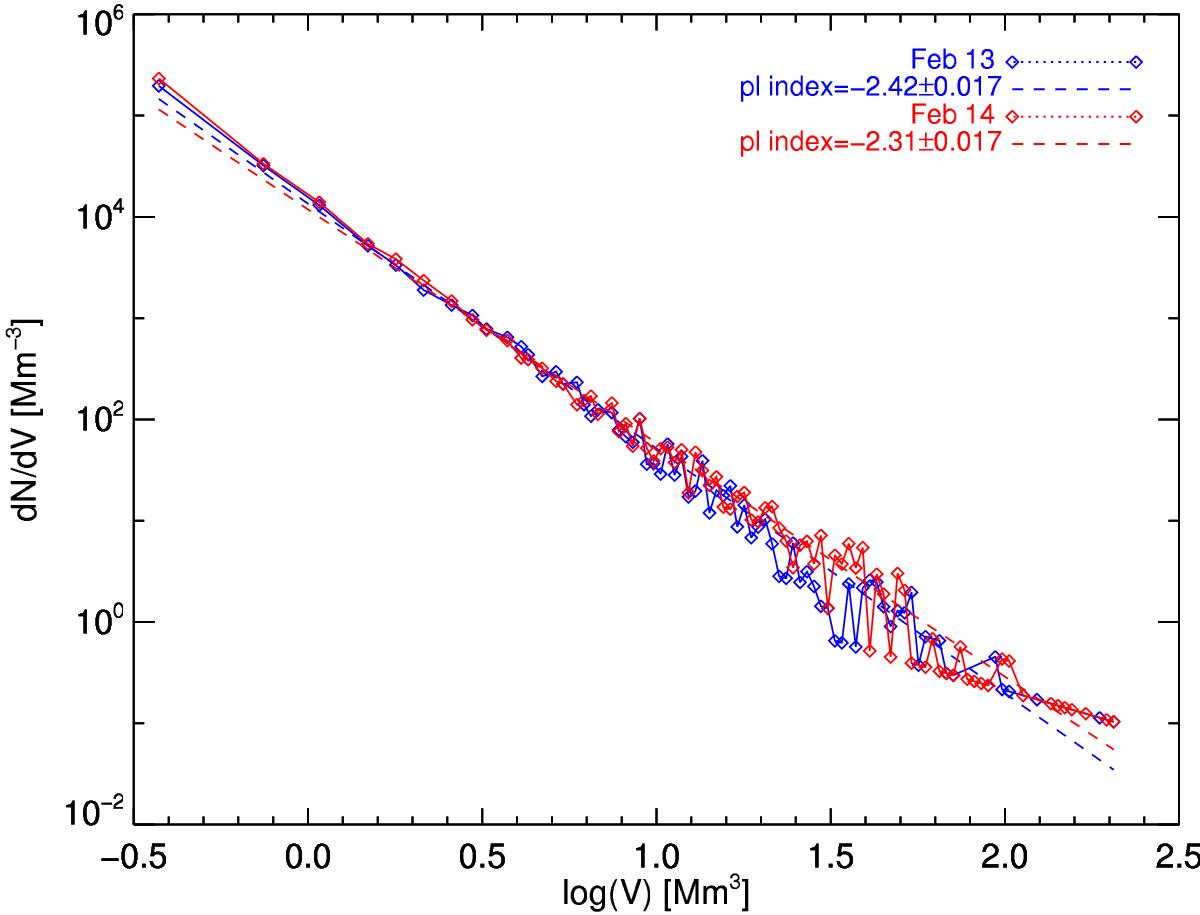
Distributions of UCS volumes for the two snapshots on February 13 and 14, 2011, using the same color notation with Fig. 4. As all observations related to the high-resolution snapshots, the power-law fitted distribution of the volumes flattens from February 13 to February 14.
Current usage metrics show cumulative count of Article Views (full-text article views including HTML views, PDF and ePub downloads, according to the available data) and Abstracts Views on Vision4Press platform.
Data correspond to usage on the plateform after 2015. The current usage metrics is available 48-96 hours after online publication and is updated daily on week days.
Initial download of the metrics may take a while.