Fig. 4
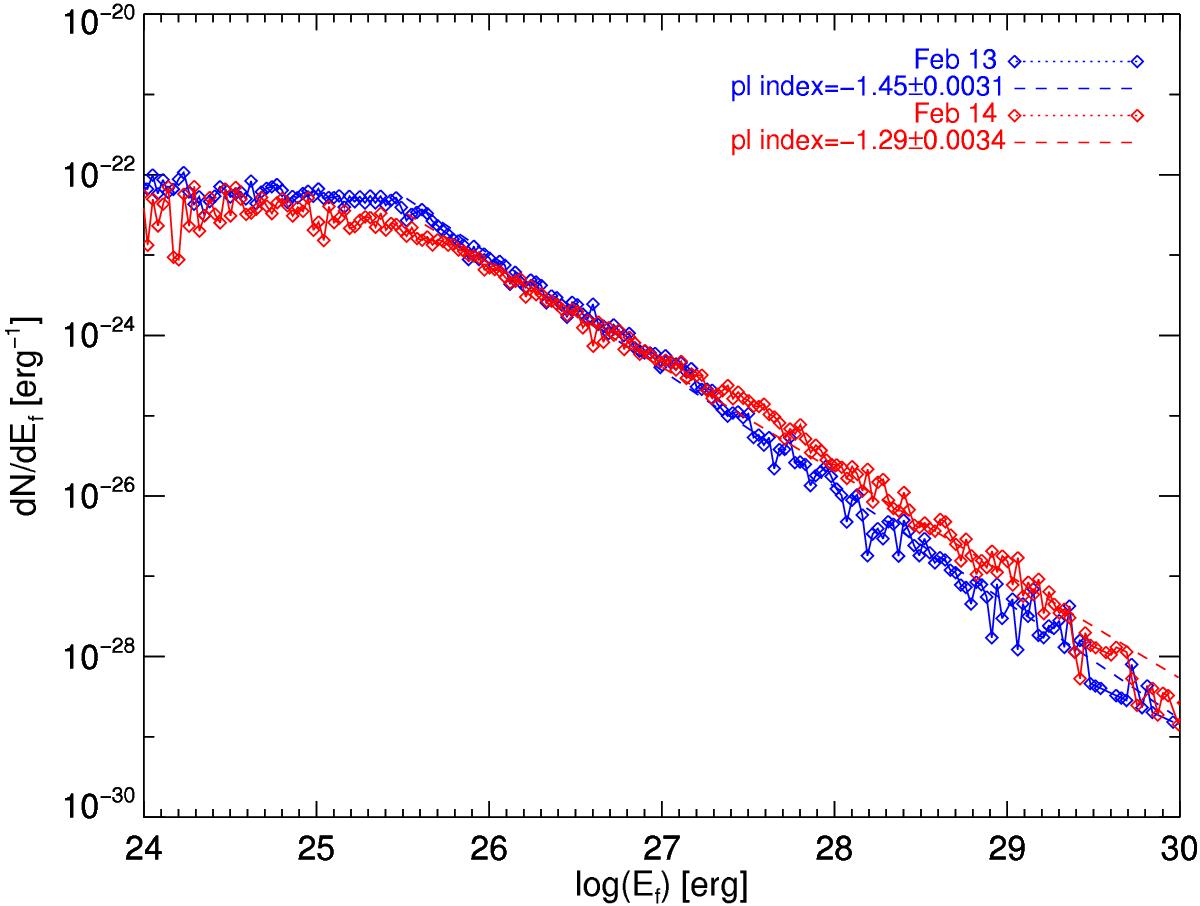
Histograms of the free magnetic energy of UCS based on the clustering identification process performed on both high-resolution snapshots. Notice the decrease in the absolute power law index from the February 13 (blue), to the February 14 (red) snapshot. The corresponding fits use the respective colors while legends provide the power-law (pl) index for each snapshot.
Current usage metrics show cumulative count of Article Views (full-text article views including HTML views, PDF and ePub downloads, according to the available data) and Abstracts Views on Vision4Press platform.
Data correspond to usage on the plateform after 2015. The current usage metrics is available 48-96 hours after online publication and is updated daily on week days.
Initial download of the metrics may take a while.