Fig. 2
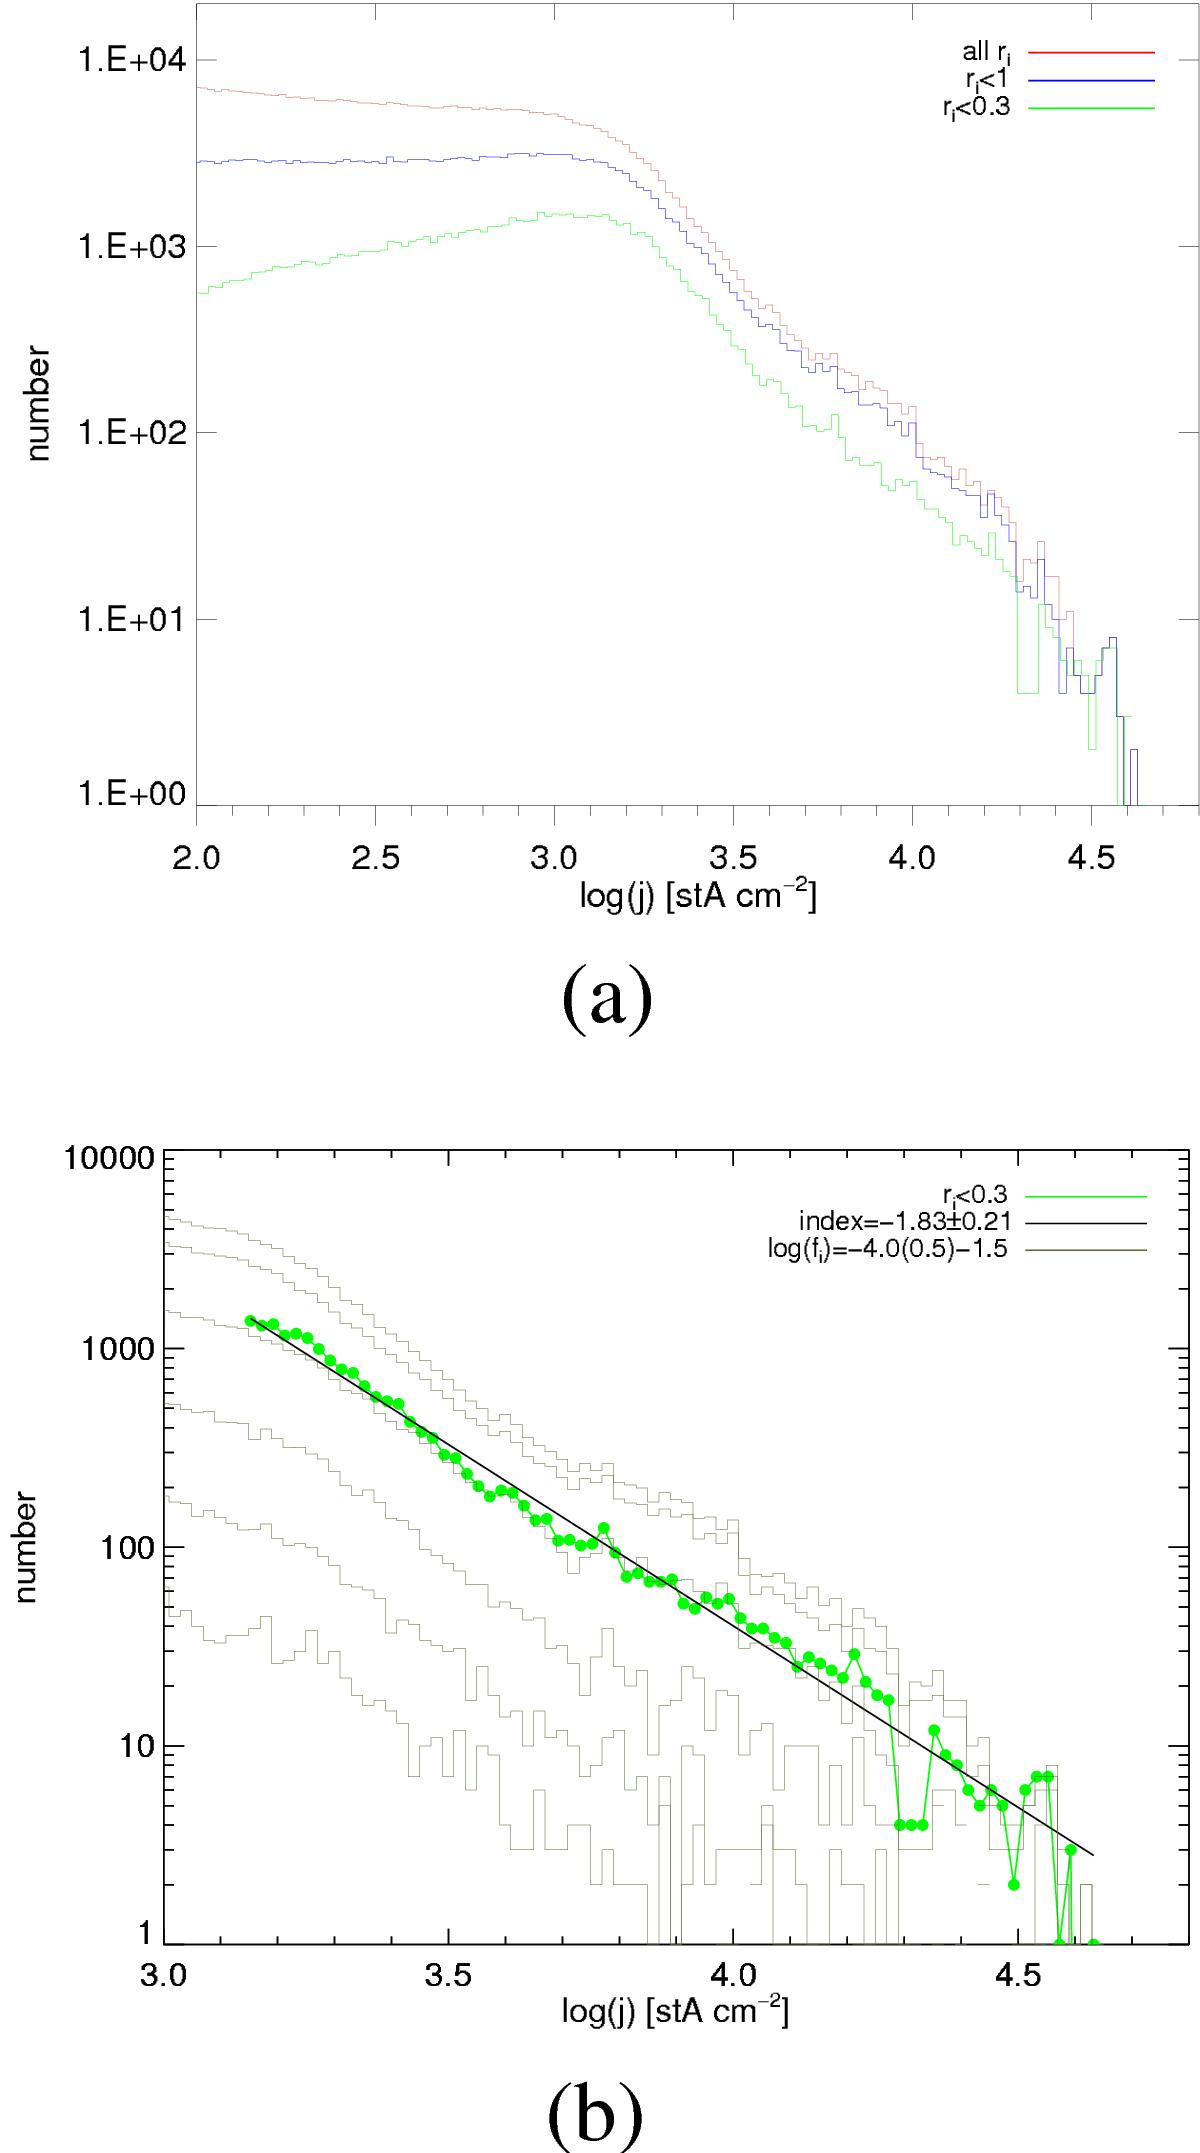
Logarithmic histogram of the electric current density for different threshold values of the free-energy accuracy factor a), and zoom of the ri< 0.3 curve and power law fit to it b) for the snapshot of February 13, 2011 at 03:58 UT. Also shown are histograms of the current density for different values of the absolute fractional flux increase, |fi|.
Current usage metrics show cumulative count of Article Views (full-text article views including HTML views, PDF and ePub downloads, according to the available data) and Abstracts Views on Vision4Press platform.
Data correspond to usage on the plateform after 2015. The current usage metrics is available 48-96 hours after online publication and is updated daily on week days.
Initial download of the metrics may take a while.