Free Access
Fig. 9
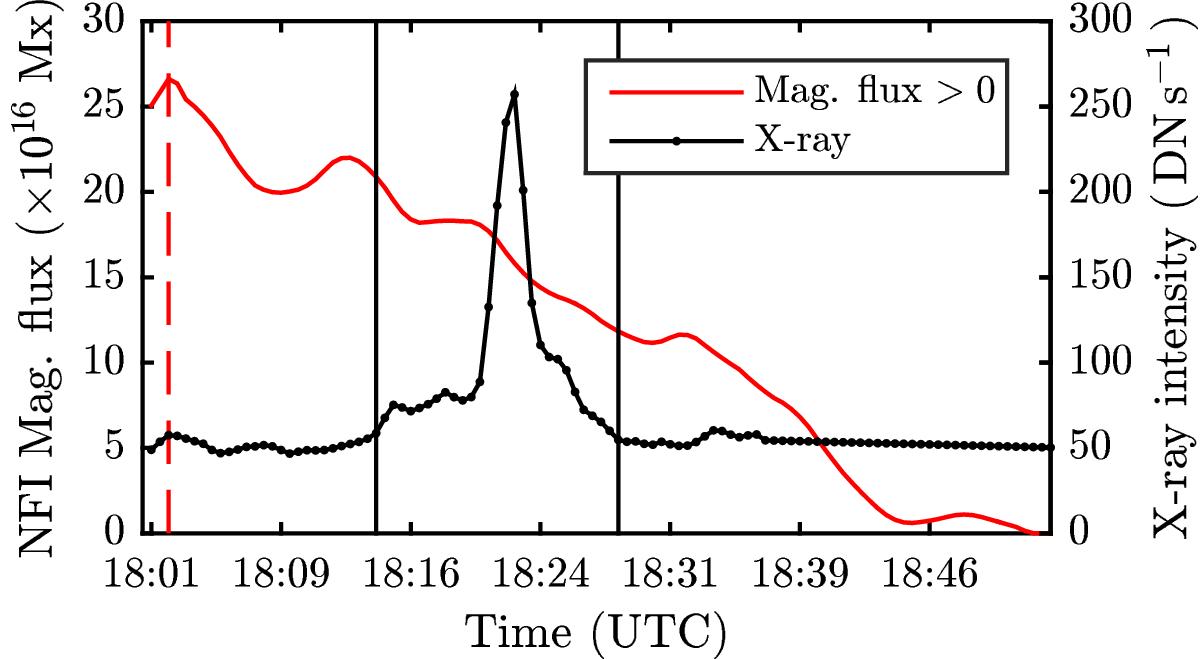
X-ray light curves with associated evolution of positive magnetic flux for the transient C2b. The red dashed vertical line points at the local maximum of the flux. The black vertical lines show the beginning and the end of the transient.
Current usage metrics show cumulative count of Article Views (full-text article views including HTML views, PDF and ePub downloads, according to the available data) and Abstracts Views on Vision4Press platform.
Data correspond to usage on the plateform after 2015. The current usage metrics is available 48-96 hours after online publication and is updated daily on week days.
Initial download of the metrics may take a while.