Fig. 7
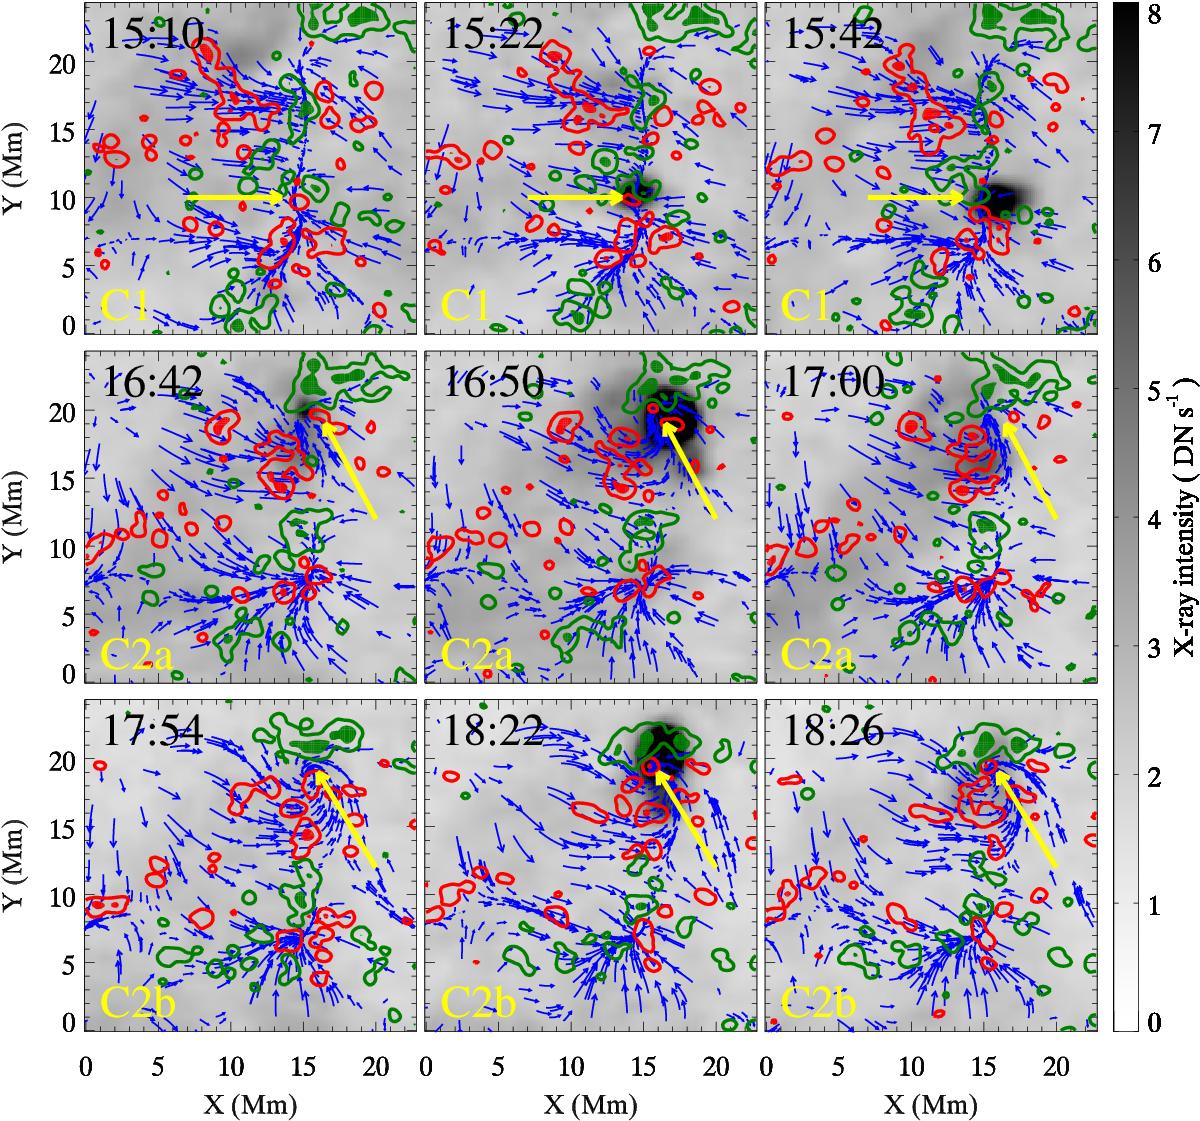
X-ray images (gray color table) and contours of the NFI magnetograms in region C of Fig. 6. Red/green contours outline positive/negative polarity magnetic flux, respectively. Filled contours follow +/−40 G, thin contours +/−10 G. The blue arrows are the velocity vectors and show the direction of the flow. Their length is scaled linearly with the magnitude of the flow. The yellow arrows point at the location of the X-ray transients (C1, C2a, C2b).
Current usage metrics show cumulative count of Article Views (full-text article views including HTML views, PDF and ePub downloads, according to the available data) and Abstracts Views on Vision4Press platform.
Data correspond to usage on the plateform after 2015. The current usage metrics is available 48-96 hours after online publication and is updated daily on week days.
Initial download of the metrics may take a while.