Fig. 6
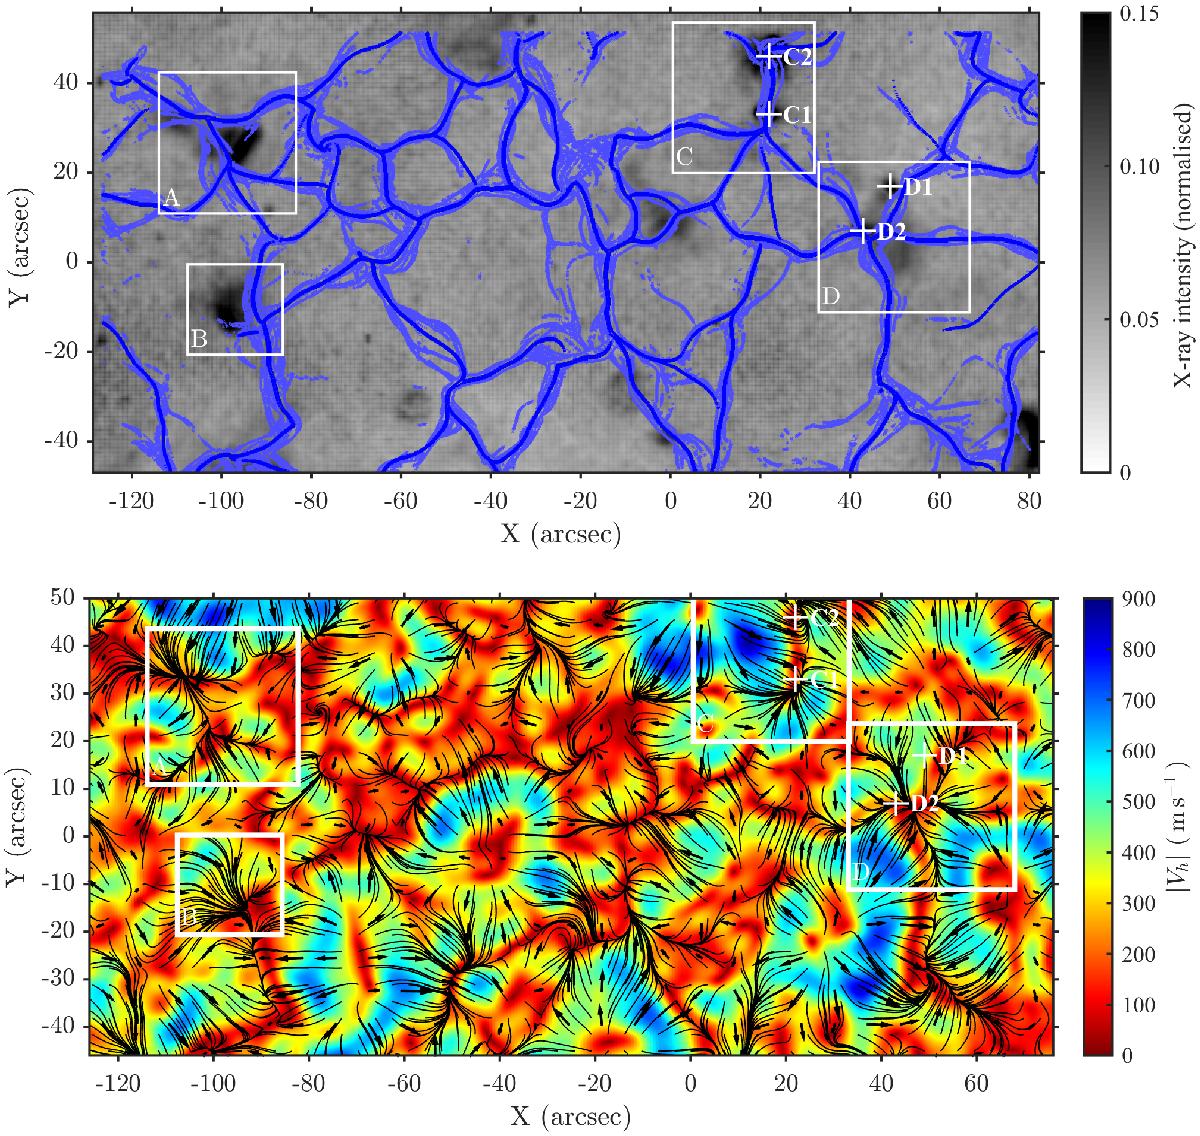
Top: supergranular network lanes (blue lanes). The gray background is the 4-h-averaged absolute running-difference image from XRT. Bottom: velocity field associated with the SOT field of view. The flow map is an average over 4-h. The coloured background is the magnitude of the horizontal velocity. The small black arrows show the orientation of the flow.
Current usage metrics show cumulative count of Article Views (full-text article views including HTML views, PDF and ePub downloads, according to the available data) and Abstracts Views on Vision4Press platform.
Data correspond to usage on the plateform after 2015. The current usage metrics is available 48-96 hours after online publication and is updated daily on week days.
Initial download of the metrics may take a while.