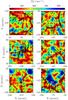
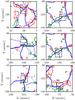
Fig. 5

Left: close-ups on the flow at the sites of the events E1 till E6 shown in Fig. 4. The flows are averaged over 1 h and smoothed over 4 Mm. The coloured background is the magnitude of the horizontal flow velocity. The black lines are the streamlines and the arrows indicate the flow direction. Right: same FOVs with the supergranular boundaries displayed as blue lanes; the green and red contours (respectively) are the magnetic field at −5 G and + 5 G from the 4 h-averaged MDI magnetogram. The blue lanes are darker when they surround bigger, more persistent supergranules, and lighter for smaller, noisier supergranular boundaries.
Current usage metrics show cumulative count of Article Views (full-text article views including HTML views, PDF and ePub downloads, according to the available data) and Abstracts Views on Vision4Press platform.
Data correspond to usage on the plateform after 2015. The current usage metrics is available 48-96 hours after online publication and is updated daily on week days.
Initial download of the metrics may take a while.