Fig. 4
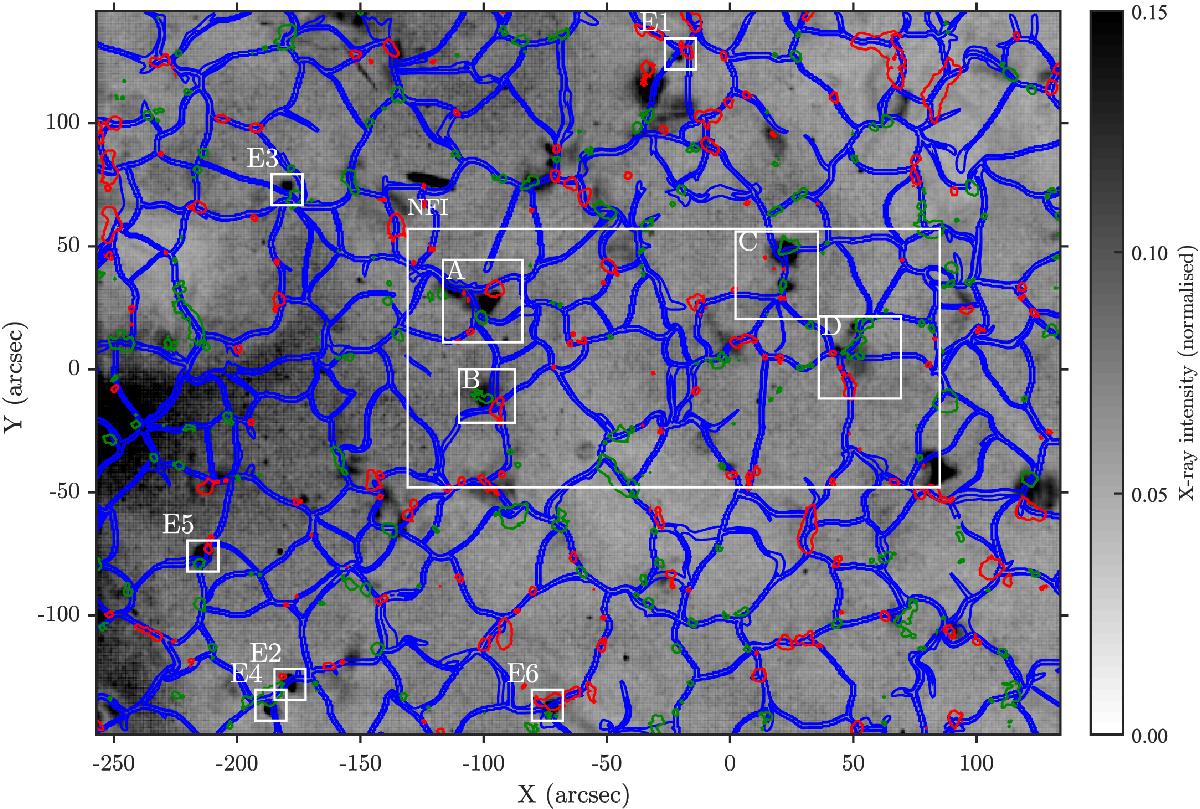
Mean of absolute running-difference XRT images, normalised by the average XRT image (Eq. (1)). Each image in the series is taken 3 min apart from the previous and the next. The blue contours are the supergranular lanes, from the 4-h averaged MDI flow field. The green and red contours (respectively) are the magnetic field strength at −10 G/+ 10 G from the 4 h-averaged MDI magnetogram. The white rectangle is the FOV of SOT (Fig. 6). The smaller white rectangle encompass the X-ray transients.
Current usage metrics show cumulative count of Article Views (full-text article views including HTML views, PDF and ePub downloads, according to the available data) and Abstracts Views on Vision4Press platform.
Data correspond to usage on the plateform after 2015. The current usage metrics is available 48-96 hours after online publication and is updated daily on week days.
Initial download of the metrics may take a while.