Fig. 16
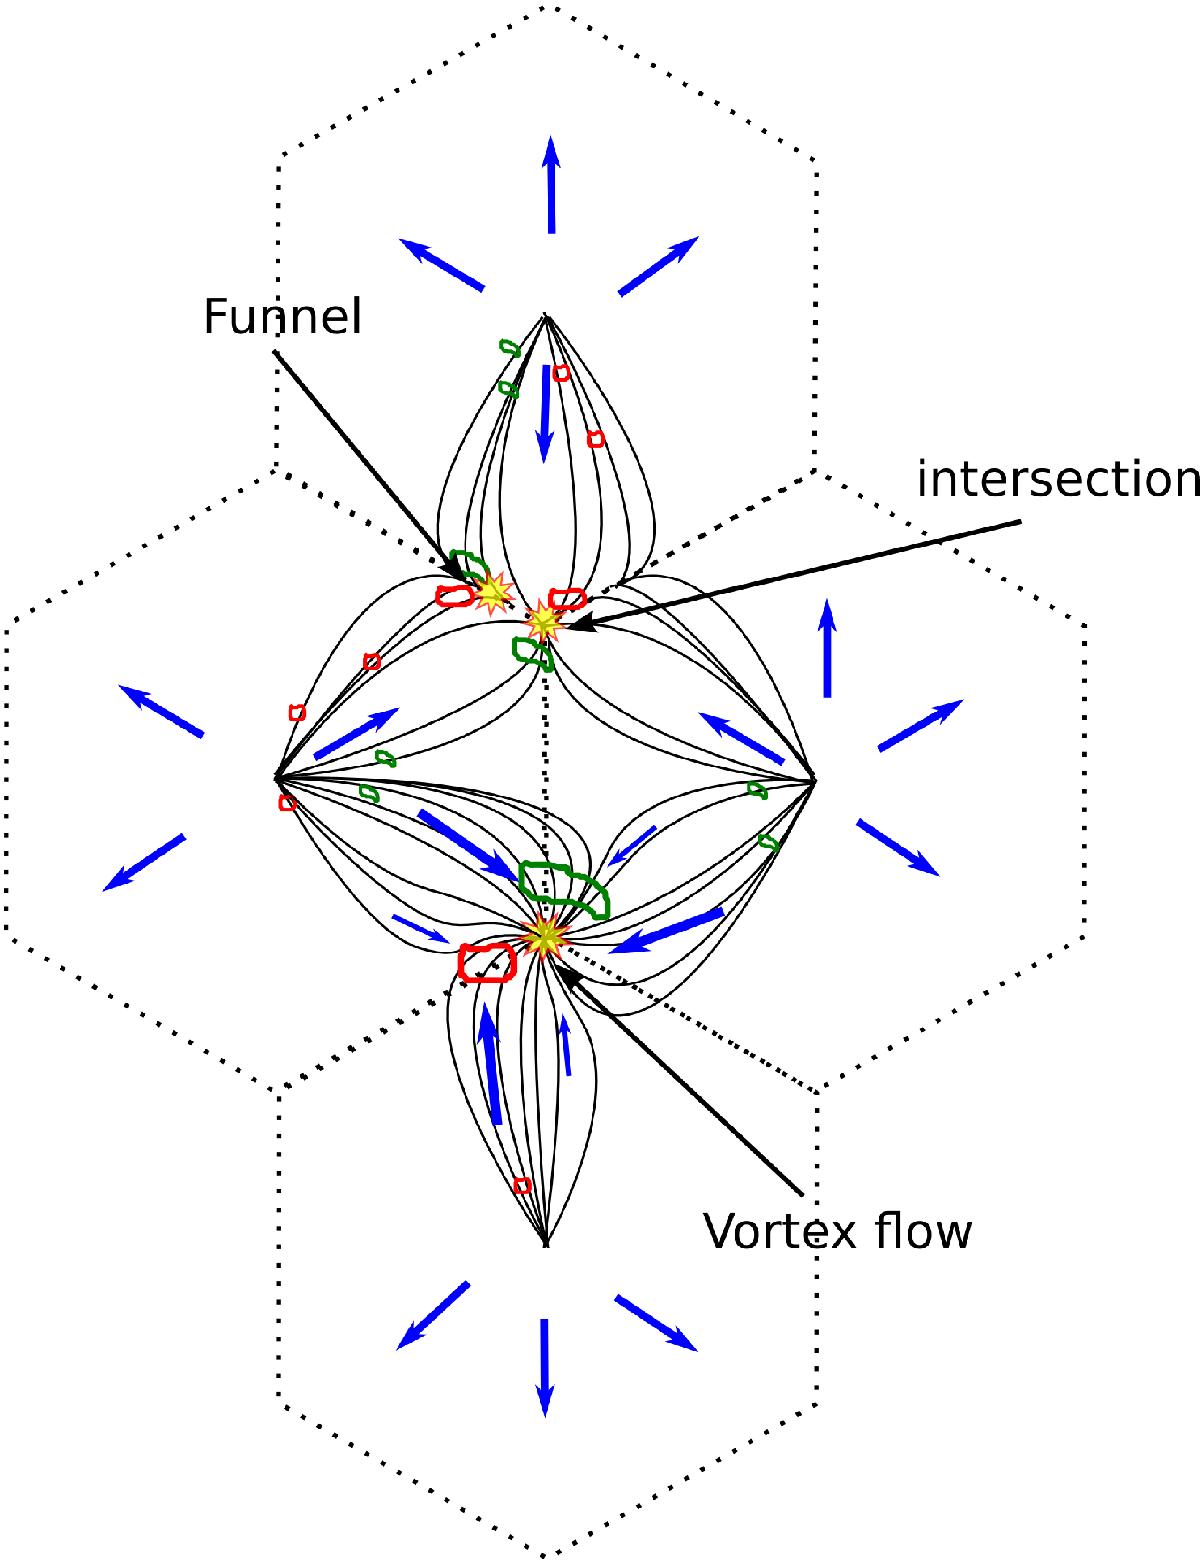
Sketch of the different steps leading to an X-ray transient. The hexagonal dashed lines represent idealised supergranular boundaries. The black lines are streamlines of the flow. The blue arrows show the main orientation of the flow. Bigger arrows symbolise faster flows than the smaller arrows. The yellow stars represent X-ray transient events. The green and red thick contours represent magnetic features of opposite polarity.
Current usage metrics show cumulative count of Article Views (full-text article views including HTML views, PDF and ePub downloads, according to the available data) and Abstracts Views on Vision4Press platform.
Data correspond to usage on the plateform after 2015. The current usage metrics is available 48-96 hours after online publication and is updated daily on week days.
Initial download of the metrics may take a while.