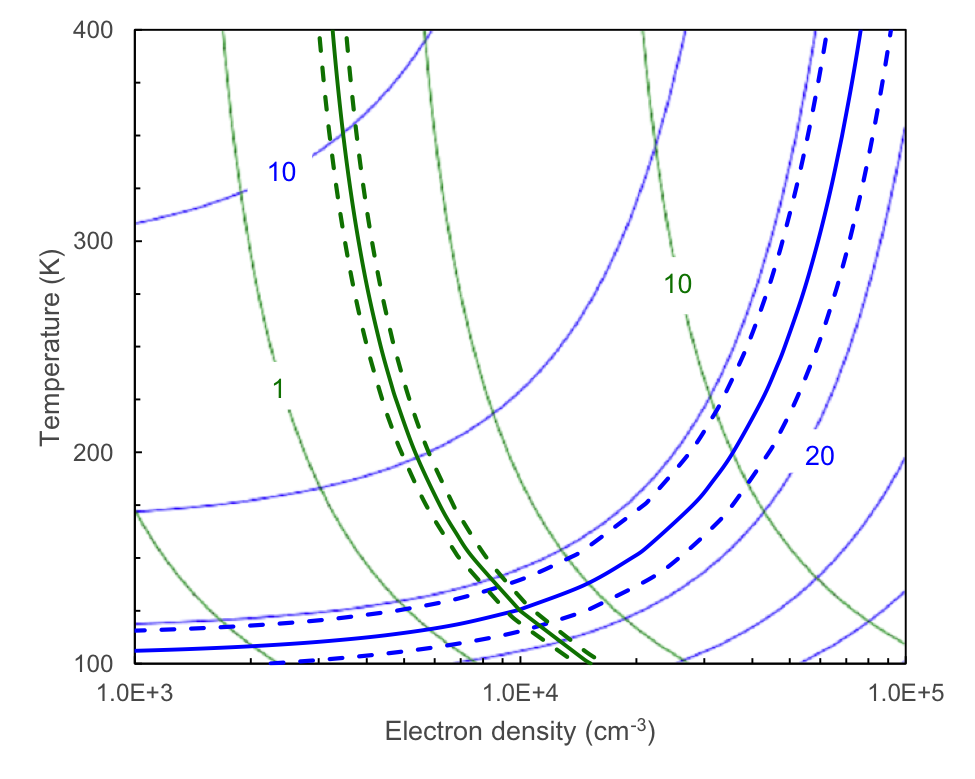
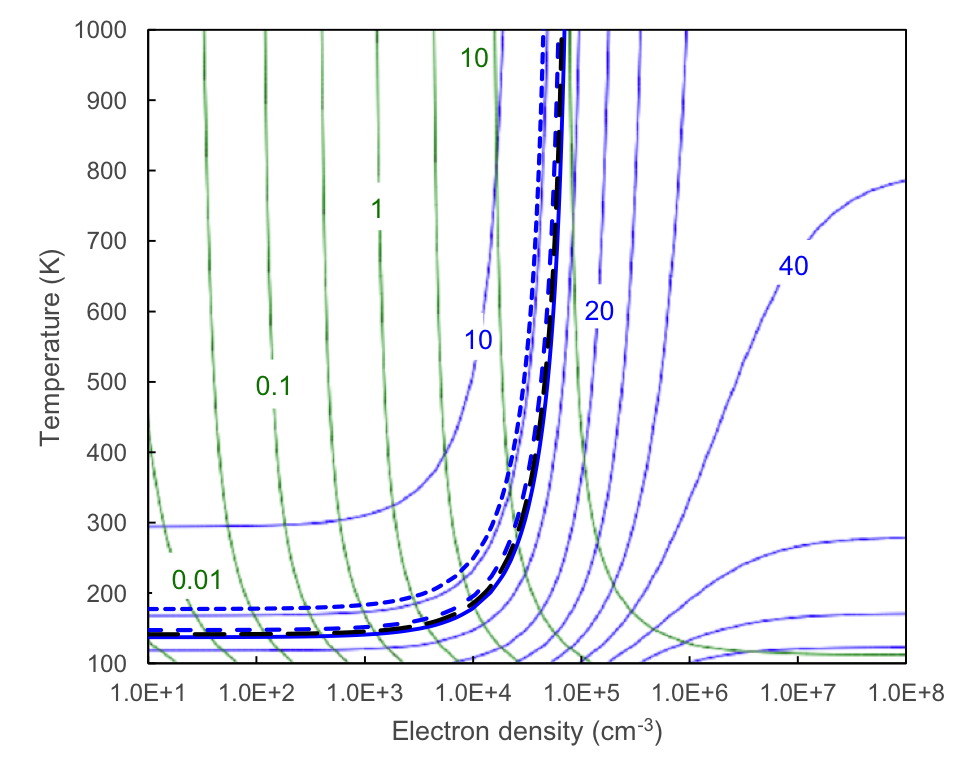
Fig. 4
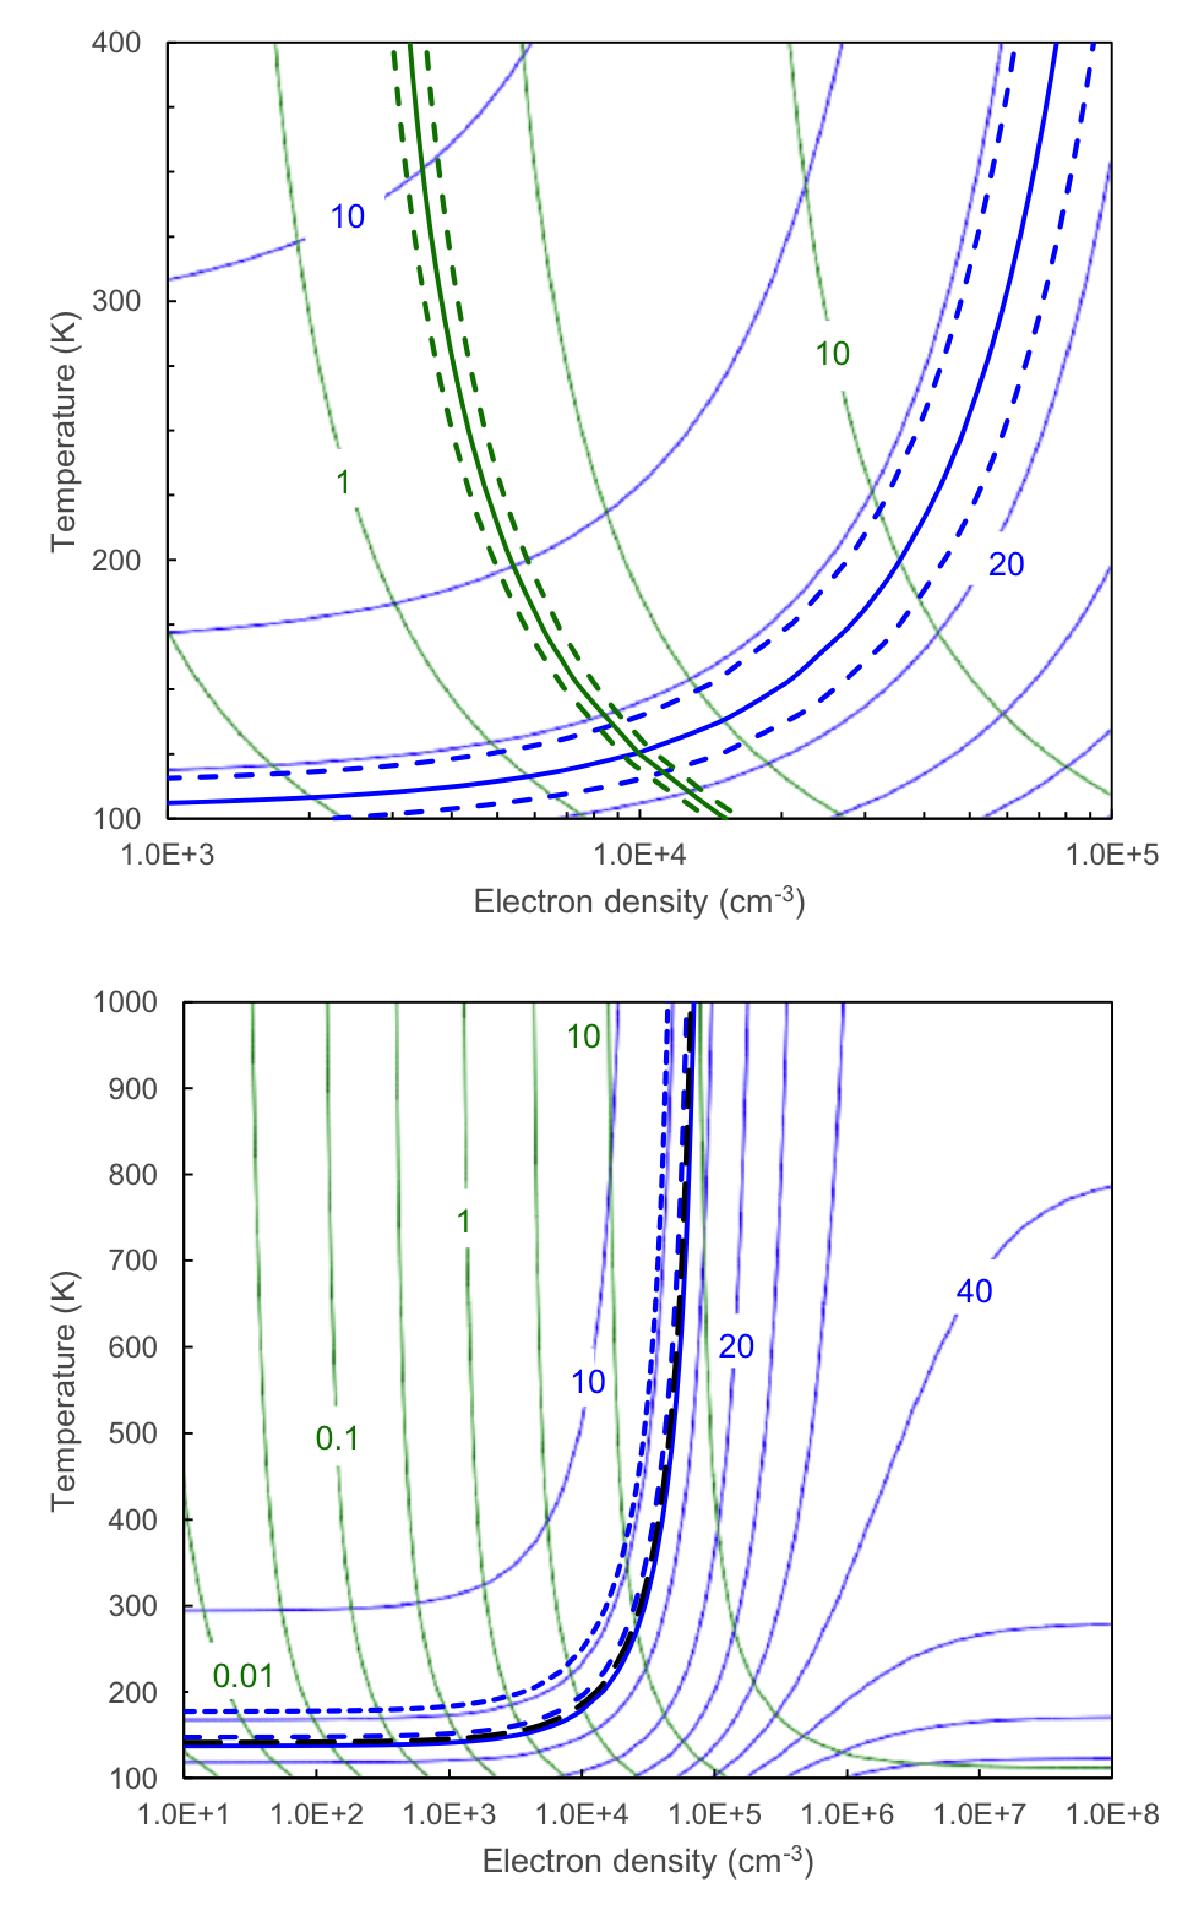
Top: observed [O I] 63.2/145.5 (blue) and [O I] 63.2/[C II] 157.7 line ratio (green) contours compared to expectations for a single-component model. The observed ratios for the regions immediately outside the FIR 3 jet are indicated with heavy solid contours, and the ±1σ band by dashed contours. Thin contours indicate the constant line ratios, covering the plotted range of density and temperature, with logarithmically-spaced contours. The families of curves intersect near ne = 104cm-3 and T = 130 K, which lie in the ranges common for photodissociation regions in the Orion molecular-cloud complex. Bottom: [O I] 63.2/145.5 intensity ratios observed along the jet plotted as heavy blue curves: FIR 4 (shortest dashes), FIR 3 (solid), SW/NE of FIR 3 (medium/long dashes). At high temperatures the intensity ratios would indicate electron density in the range 5 × 10⁴–8 × 104cm-3.
Current usage metrics show cumulative count of Article Views (full-text article views including HTML views, PDF and ePub downloads, according to the available data) and Abstracts Views on Vision4Press platform.
Data correspond to usage on the plateform after 2015. The current usage metrics is available 48-96 hours after online publication and is updated daily on week days.
Initial download of the metrics may take a while.