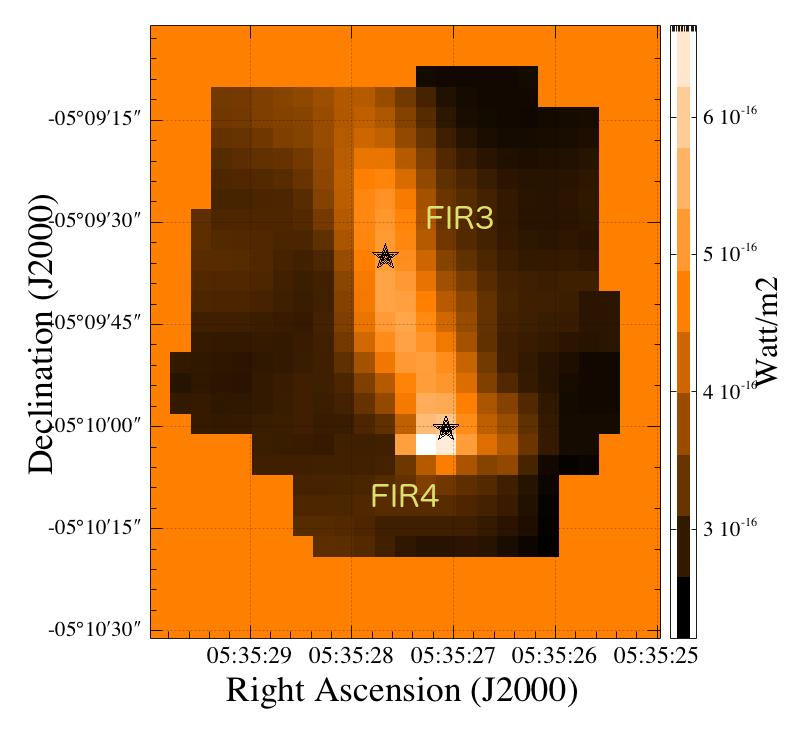
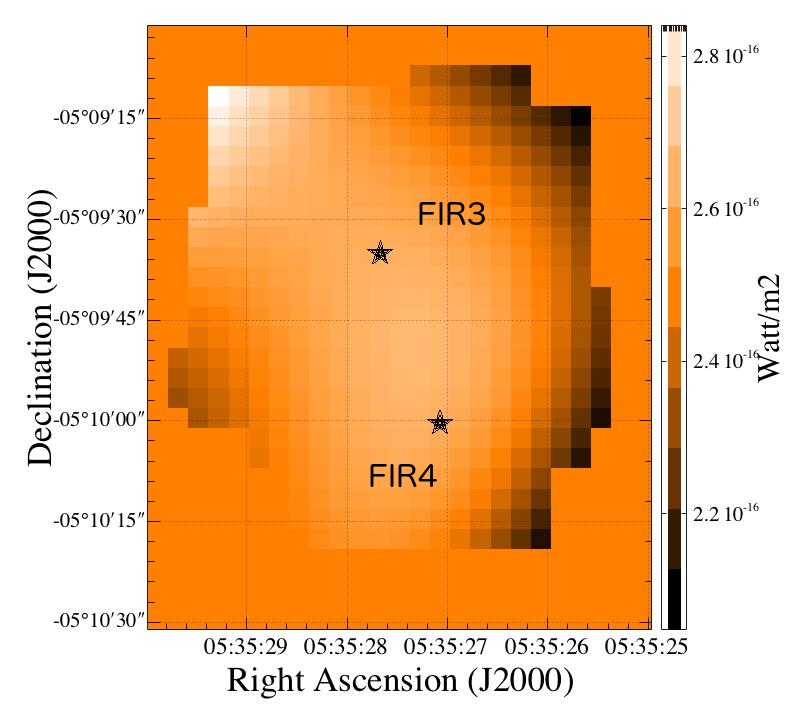
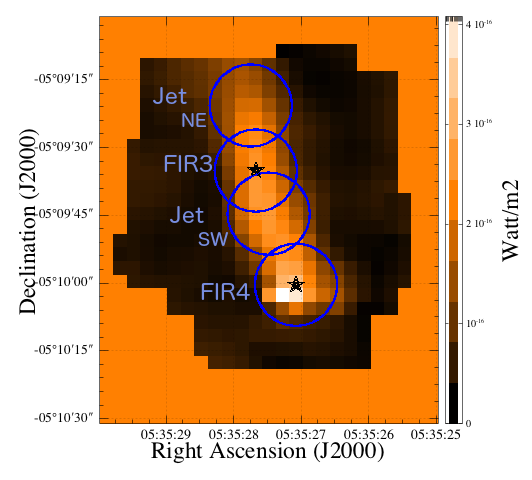
Fig. 2
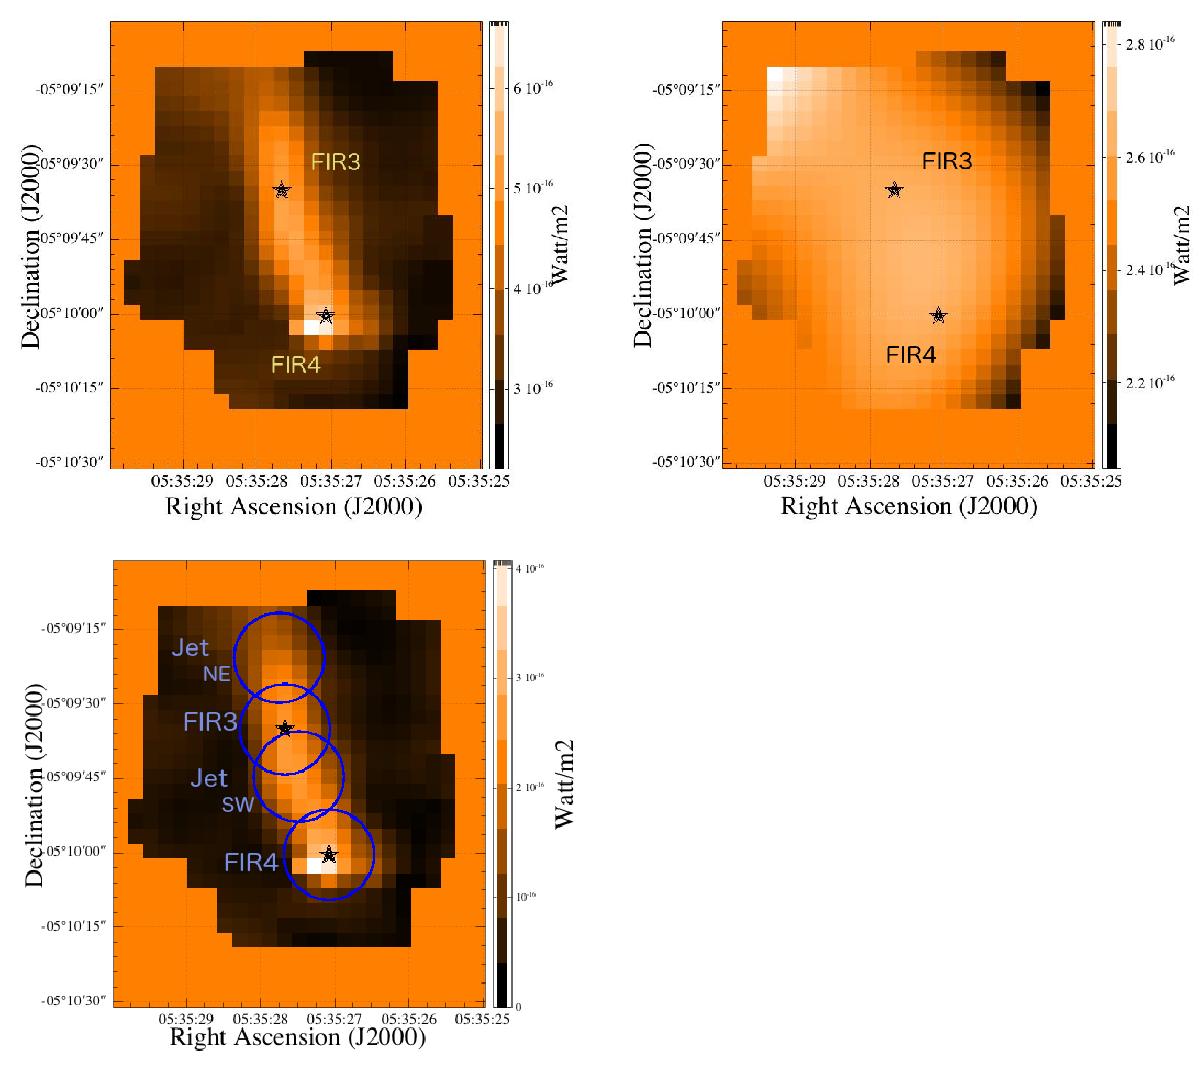
Top left: [O I] 63 μm line map of the OMC-2 region. Top right: extended emission component extracted by fitting a third order polynomial to the line map. Bottom: narrow ridge like emission component obtained after subtracting the extended emission background component. Positions, sizes, and names of the line flux aperture measurements listed in Table 2 are indicated.

Current usage metrics show cumulative count of Article Views (full-text article views including HTML views, PDF and ePub downloads, according to the available data) and Abstracts Views on Vision4Press platform.
Data correspond to usage on the plateform after 2015. The current usage metrics is available 48-96 hours after online publication and is updated daily on week days.
Initial download of the metrics may take a while.