Fig. 1
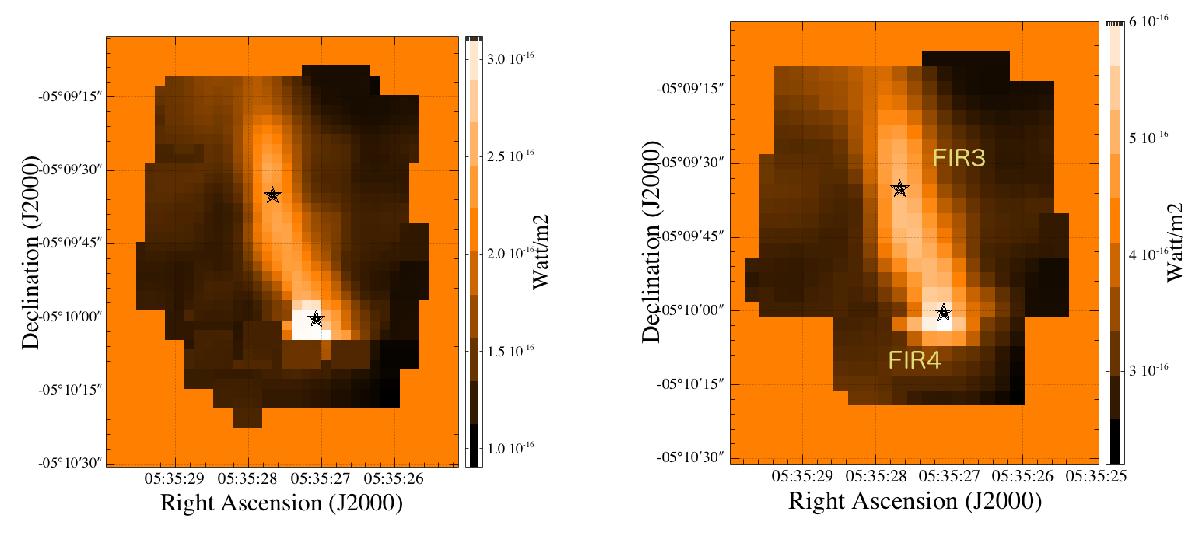
Left: [O I] 63 μm line map generated with Drizzle and specInterpolate for 2′′. Right: [O I] 63 μm line map generated with specProject and specInterpolate for 3′′. The left image provides a sharper spatial reconstruction north to −05° 10′ of the FIR 3 jet component by taking advantage of drizzling but the right image has been used for this study to achieve a homogeneous and consistent mapping of the entire area.
Current usage metrics show cumulative count of Article Views (full-text article views including HTML views, PDF and ePub downloads, according to the available data) and Abstracts Views on Vision4Press platform.
Data correspond to usage on the plateform after 2015. The current usage metrics is available 48-96 hours after online publication and is updated daily on week days.
Initial download of the metrics may take a while.