Free Access
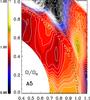
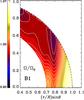
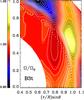
Fig. 4
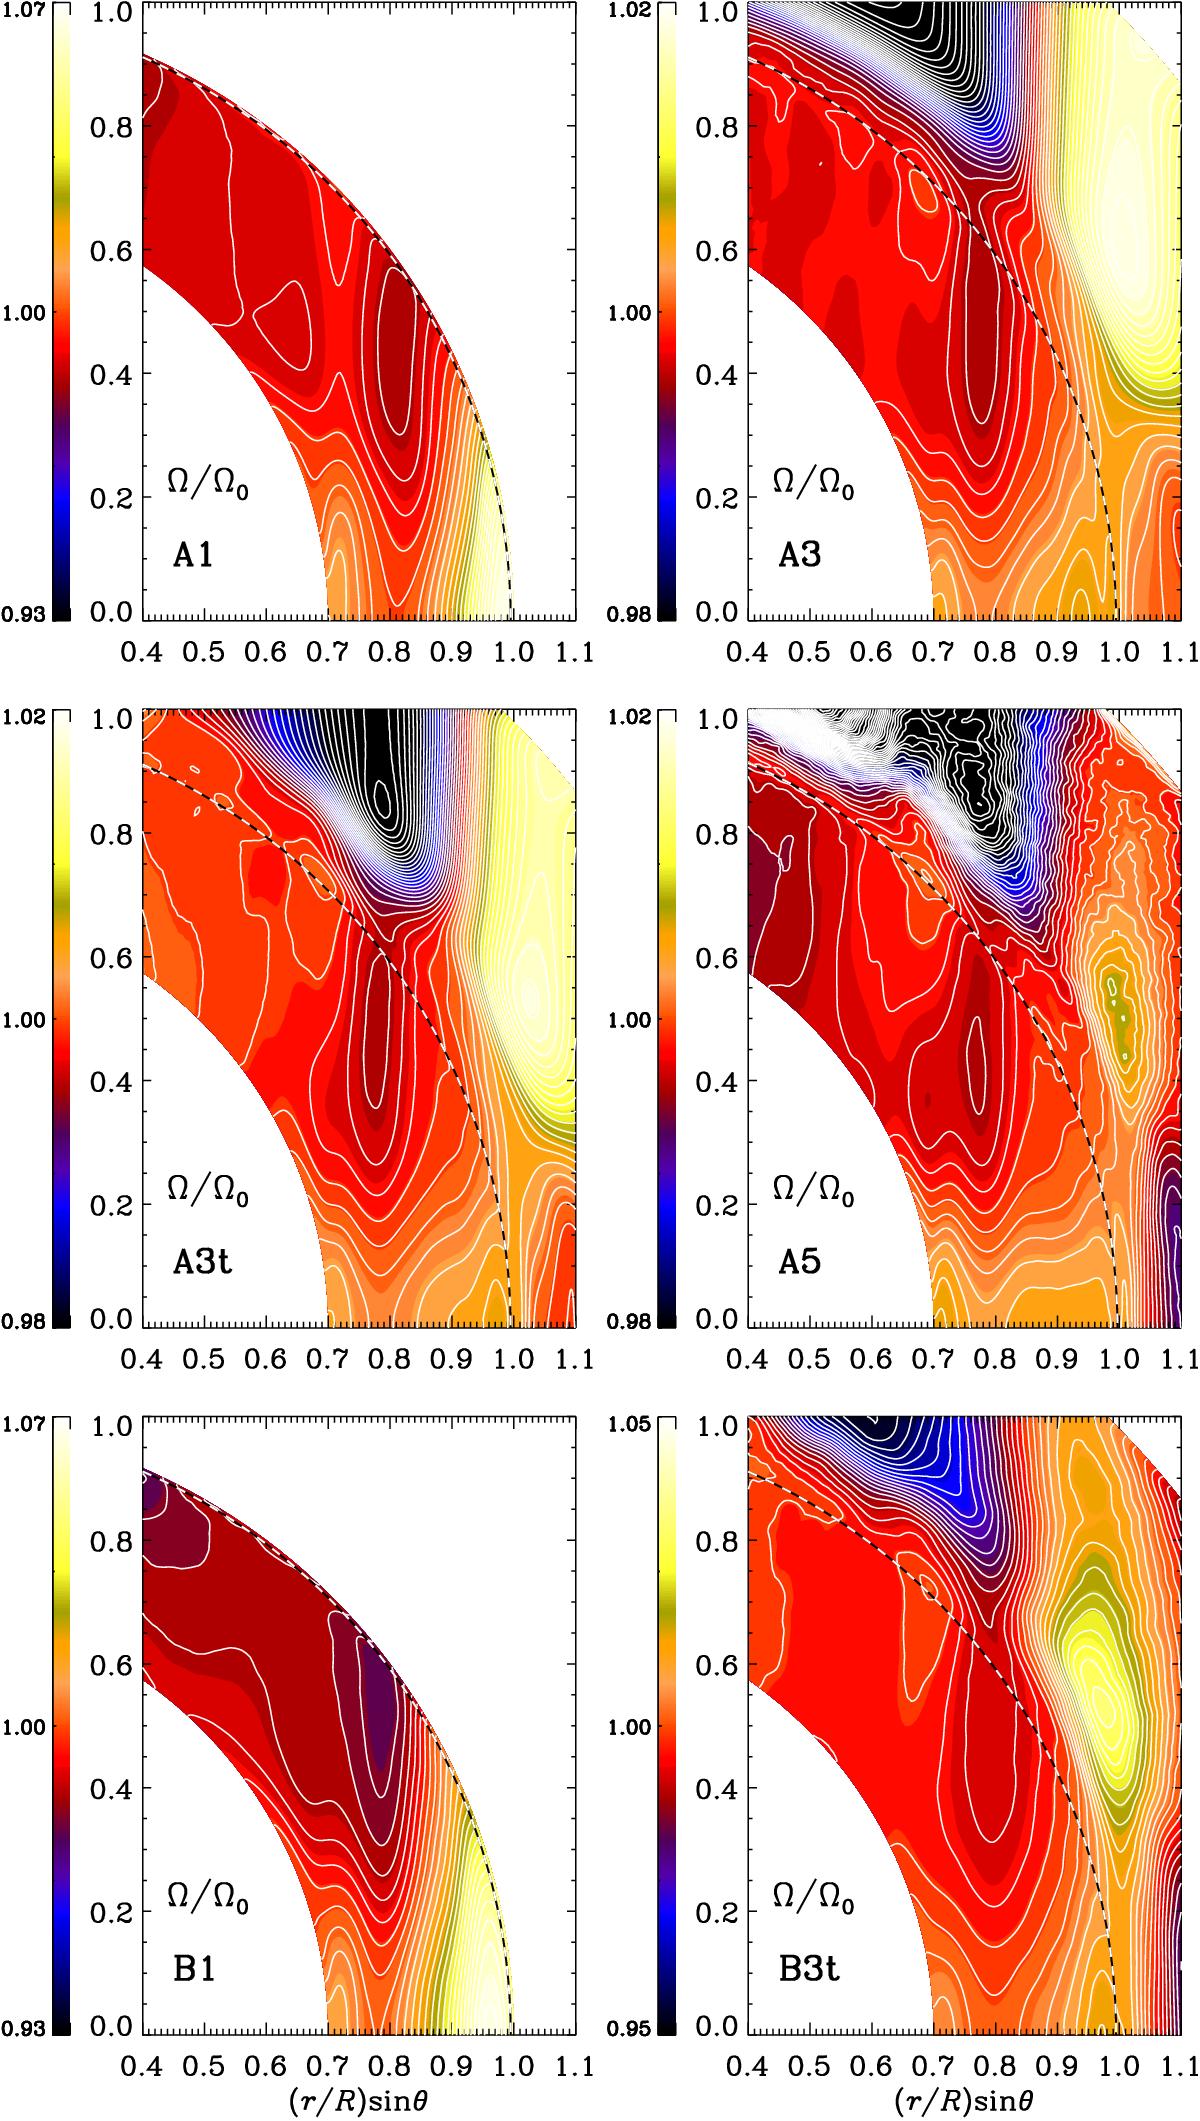
Angular velocity Ω(r,θ)/Ω0 for Runs A1 and A3 (top row), Runs A3t and A5 (middle row) and Runs B1 and B3t (bottom row). Here, ![]() is the local rotation rate. The dashed lines indicate the surface (r = R).
is the local rotation rate. The dashed lines indicate the surface (r = R).
This figure is made of several images, please see below:
Current usage metrics show cumulative count of Article Views (full-text article views including HTML views, PDF and ePub downloads, according to the available data) and Abstracts Views on Vision4Press platform.
Data correspond to usage on the plateform after 2015. The current usage metrics is available 48-96 hours after online publication and is updated daily on week days.
Initial download of the metrics may take a while.