Fig. 2
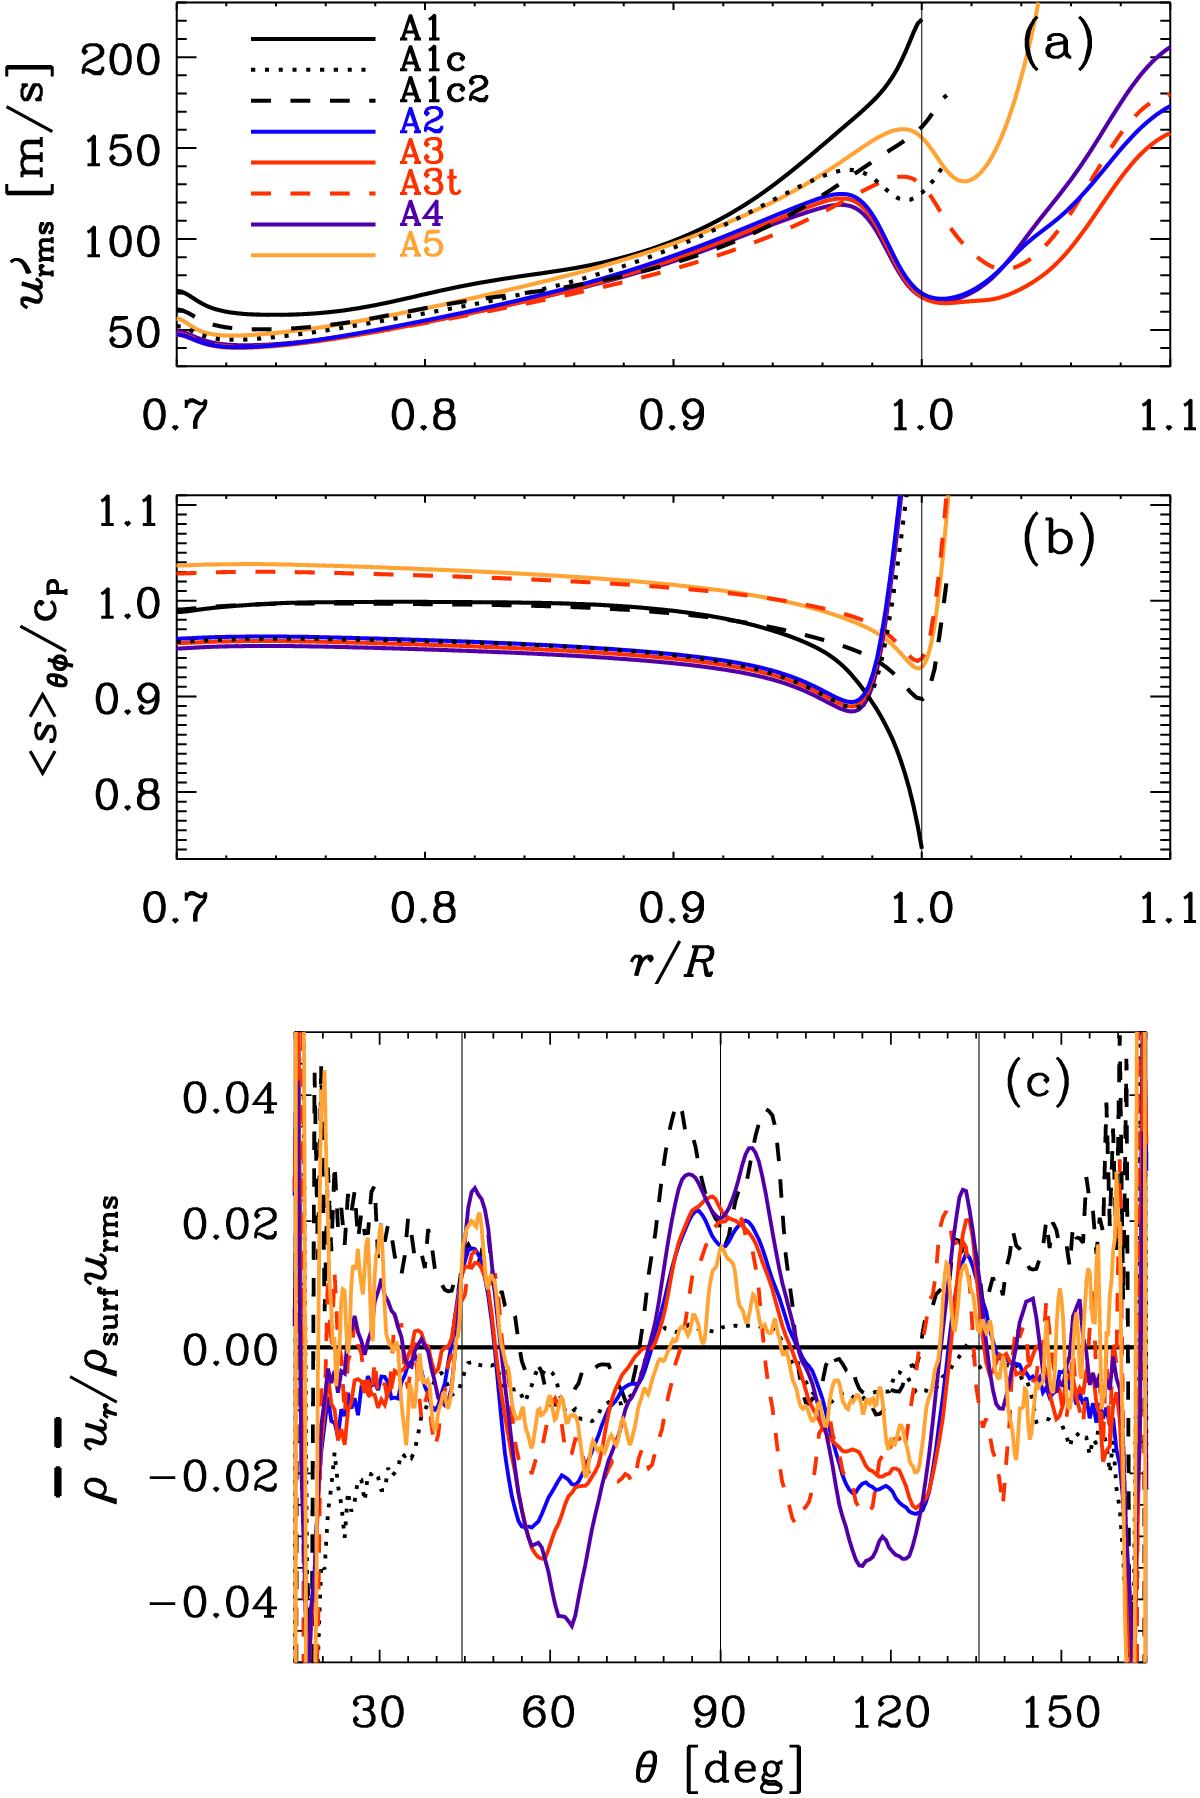
Radial profiles of azimuthally and latitudinally averaged turbulent rms velocity ![]() a) and ⟨ s ⟩ θφb) in m/s or normalized by cP respectively for Set A. Mean radial mass flux
a) and ⟨ s ⟩ θφb) in m/s or normalized by cP respectively for Set A. Mean radial mass flux ![]() c) through the surface (r = R) for Set A. The horizontal line indicates the zero value and the three vertical thin lines indicate the equator (θ = 90°) and the intersection with the inner tangent cylinder (θ−90° ≈ ± 45° latitude).
c) through the surface (r = R) for Set A. The horizontal line indicates the zero value and the three vertical thin lines indicate the equator (θ = 90°) and the intersection with the inner tangent cylinder (θ−90° ≈ ± 45° latitude).
Current usage metrics show cumulative count of Article Views (full-text article views including HTML views, PDF and ePub downloads, according to the available data) and Abstracts Views on Vision4Press platform.
Data correspond to usage on the plateform after 2015. The current usage metrics is available 48-96 hours after online publication and is updated daily on week days.
Initial download of the metrics may take a while.