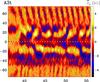
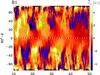
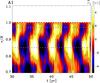
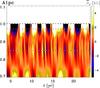
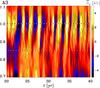
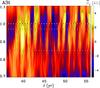
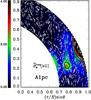
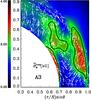
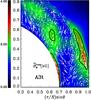
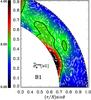
Fig. 12
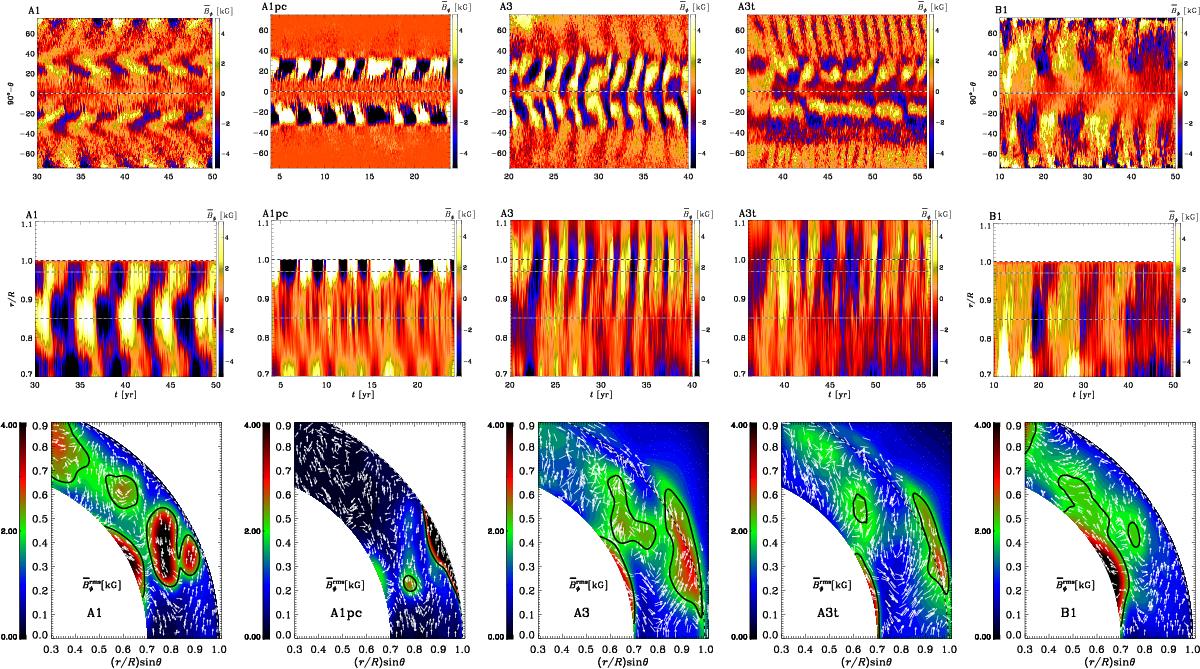
Mean toroidal magnetic field ![]() evolution as time-latitude (butterfly) diagram, plotted at a radius r = 0.98 R (top row) and time-radius diagram plotted at a 25° latitude (middle row) in kG during a 20 yr interval in the saturated stage for Runs A1, A1pc, A3, A3t, and B1. For Run B1, we plot the butterfly diagram at radius r = 0.84 R and its time interval is 40 yr. The dashed horizontal lines mark the equator (θ = π/ 2) and the radii r = R, r = 0.98 R and r = 0.85 R, respectively. Propagation of the mean magnetic field for the same runs (bottom row). Color coded
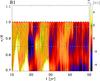
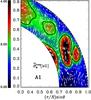
evolution as time-latitude (butterfly) diagram, plotted at a radius r = 0.98 R (top row) and time-radius diagram plotted at a 25° latitude (middle row) in kG during a 20 yr interval in the saturated stage for Runs A1, A1pc, A3, A3t, and B1. For Run B1, we plot the butterfly diagram at radius r = 0.84 R and its time interval is 40 yr. The dashed horizontal lines mark the equator (θ = π/ 2) and the radii r = R, r = 0.98 R and r = 0.85 R, respectively. Propagation of the mean magnetic field for the same runs (bottom row). Color coded ![]() is plotted during the saturated stage together with white arrows showing the direction of migration
is plotted during the saturated stage together with white arrows showing the direction of migration ![]() of an αΩ dynamo wave (Parker 1955; Yoshimura 1975); see Warnecke et al. (2014). We suppress the arrows above r = 1.05. The black solid lines indicate isocontours of
of an αΩ dynamo wave (Parker 1955; Yoshimura 1975); see Warnecke et al. (2014). We suppress the arrows above r = 1.05. The black solid lines indicate isocontours of ![]() at 2.0 kG. The dashed white lines indicate the surface (r = R).
at 2.0 kG. The dashed white lines indicate the surface (r = R).
Current usage metrics show cumulative count of Article Views (full-text article views including HTML views, PDF and ePub downloads, according to the available data) and Abstracts Views on Vision4Press platform.
Data correspond to usage on the plateform after 2015. The current usage metrics is available 48-96 hours after online publication and is updated daily on week days.
Initial download of the metrics may take a while.