Free Access
Fig. 3
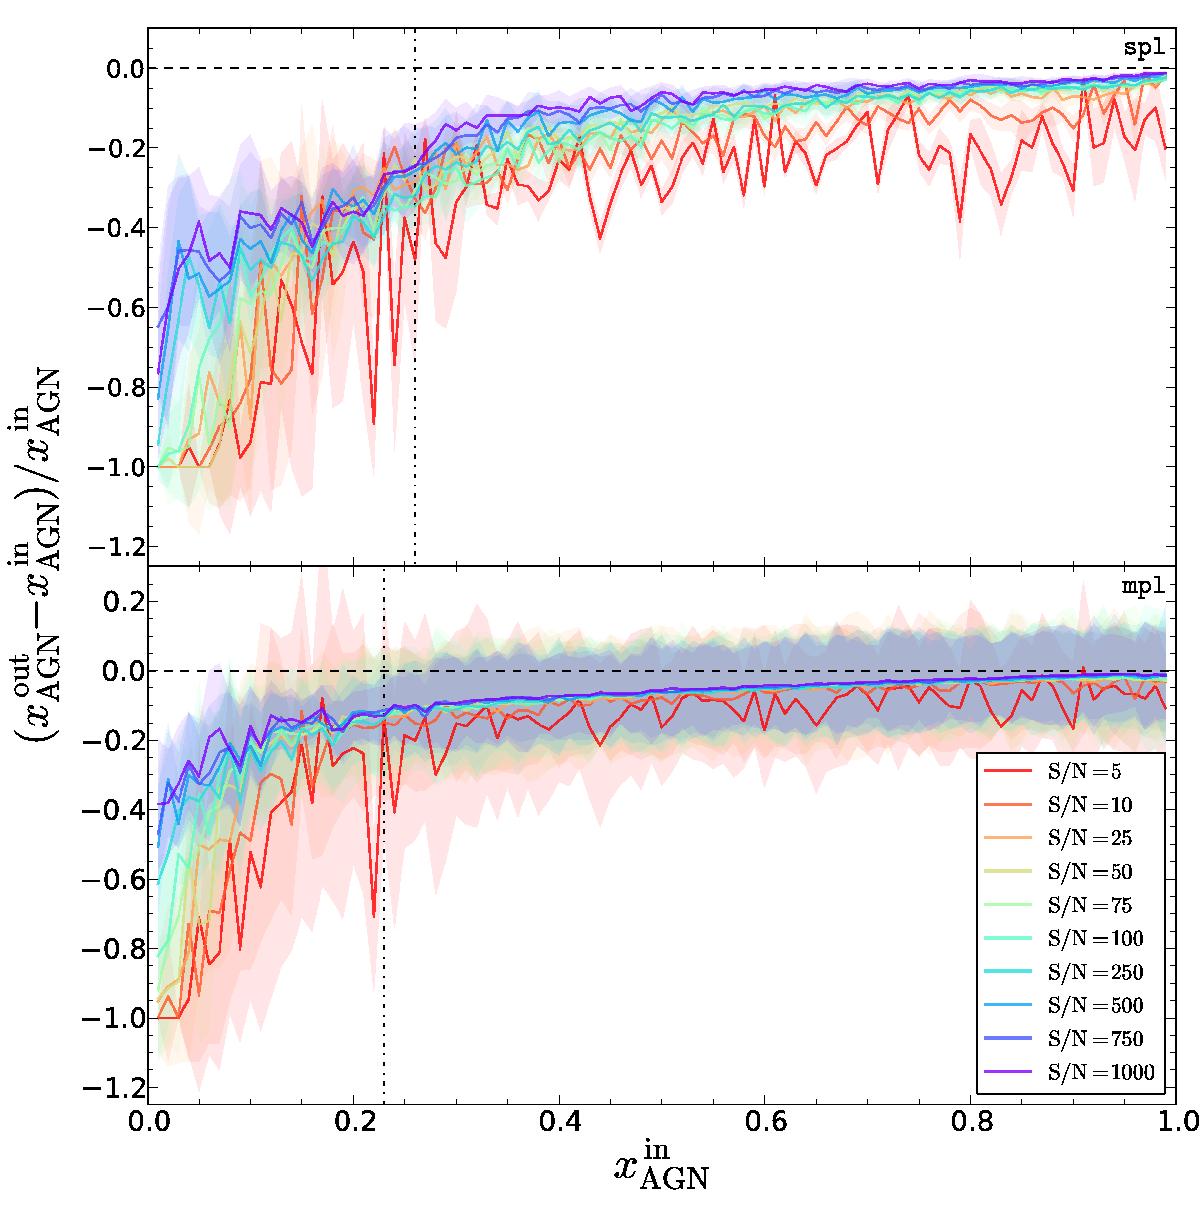
Relative error of the fractional flux contribution of the AGN ![]() as a function of
as a function of ![]() for spl and mpl fits (upper and lower panels, respectively). The vertical dash-dotted lines mark the AGN detection threshold inferred from the Gelman & Rubin (1992) convergence test (see discussion for details).
for spl and mpl fits (upper and lower panels, respectively). The vertical dash-dotted lines mark the AGN detection threshold inferred from the Gelman & Rubin (1992) convergence test (see discussion for details).
Current usage metrics show cumulative count of Article Views (full-text article views including HTML views, PDF and ePub downloads, according to the available data) and Abstracts Views on Vision4Press platform.
Data correspond to usage on the plateform after 2015. The current usage metrics is available 48-96 hours after online publication and is updated daily on week days.
Initial download of the metrics may take a while.