Fig. 2
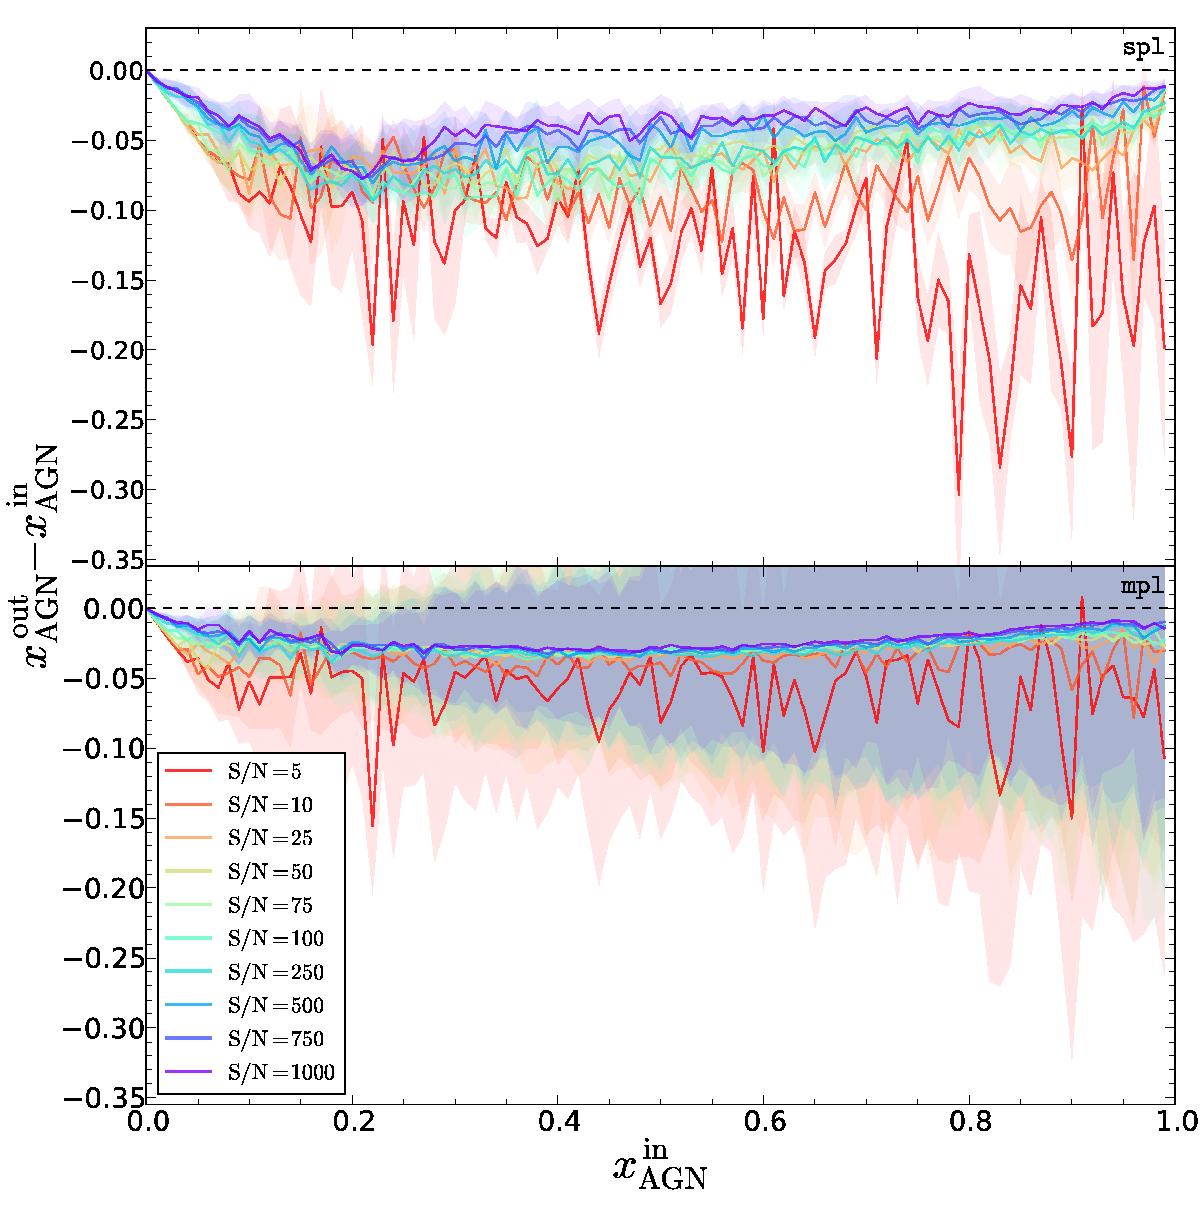
Difference between output and input AGN fractional flux contribution ![]() at λ0 as a function of
at λ0 as a function of ![]() for ten S/N values. Results obtained by fitting synthetic spectra with Starlight with a single (spl) and multiple (mpl) AGN power-law components in the base library are shown in the upper and lower panels, respectively. The shaded area corresponds to the ± 1σ standard deviation around the mean, as computed from ten Starlight fits to each synthetic spectrum.
for ten S/N values. Results obtained by fitting synthetic spectra with Starlight with a single (spl) and multiple (mpl) AGN power-law components in the base library are shown in the upper and lower panels, respectively. The shaded area corresponds to the ± 1σ standard deviation around the mean, as computed from ten Starlight fits to each synthetic spectrum.
Current usage metrics show cumulative count of Article Views (full-text article views including HTML views, PDF and ePub downloads, according to the available data) and Abstracts Views on Vision4Press platform.
Data correspond to usage on the plateform after 2015. The current usage metrics is available 48-96 hours after online publication and is updated daily on week days.
Initial download of the metrics may take a while.